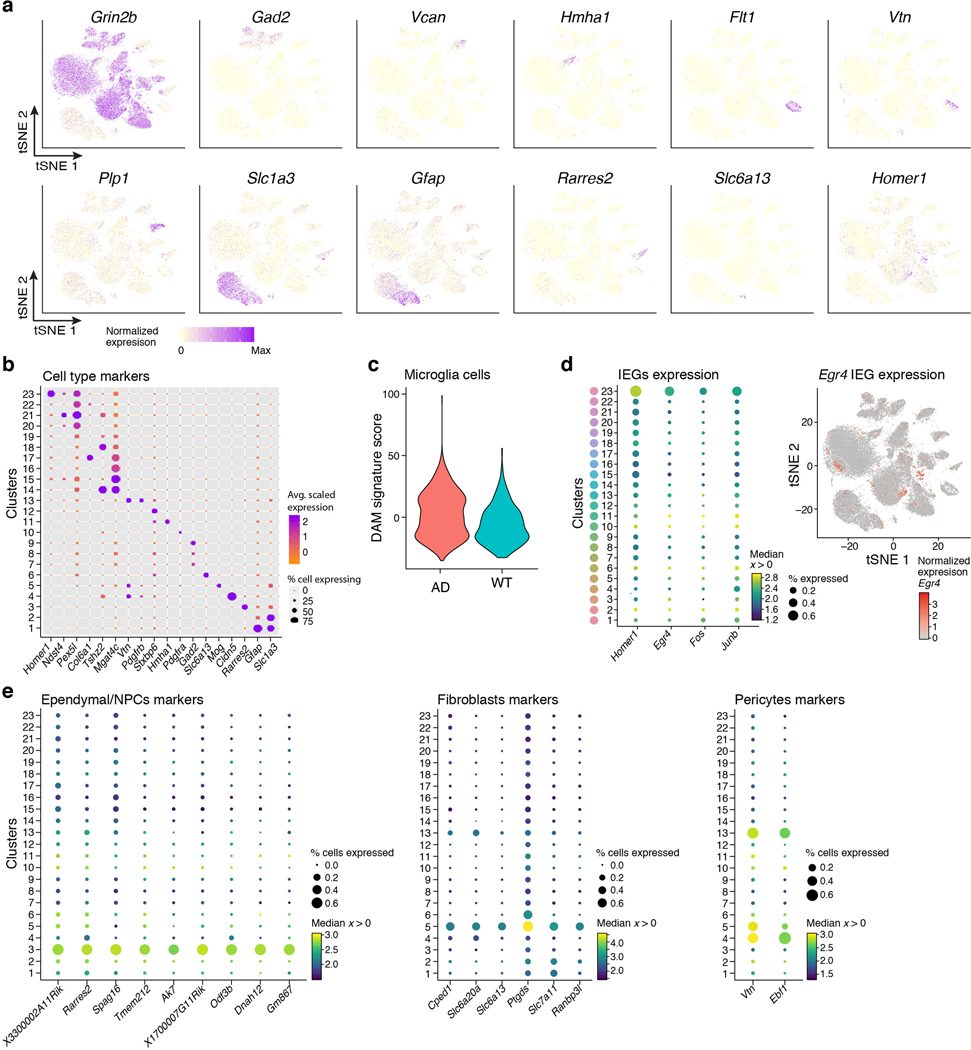
Extended Data Figure 2. Cell type marker genes and assignments.
(a) Expression of marker genes across clusters. 2-D tSNE embedding of single nuclei RNA profiles from hippocampi of WT and 5xFAD mice (as in Fig. 1b), colored by expression levels of marker genes: Grin2b (neurons), Gad2 (GABAergic neurons), Vcan (Oligodendrocytes precursor cells, OPCs), Hmha1 (microglia), Flt1 (endothelial), Vtn (pericytes), Plp1 (oligodendrocytes), Slc1a3 (astrocytes), Gfap (astrocytes), Rarres2 (ependymal/NPCs), Slc6a13 (fibroblasts), Homer1 (immediate early gene, IEGs). (b) Clusters and marker genes. Dot plot showing the expression level (color scale) and the percent of cells expressing (dot size) marker genes across all clusters (rows). Cluster numbers as in Fig. 1b. (c) Disease associated microglia (DAM) signature enriched in AD. Violin plots showing the distribution in WT (n=8 animals, 896 cells) and AD (n=8 animals, 1,540 cells) of microglia expression scores for signatures of genes up-regulated in DAM compared to homeostatic microglia (from keren-Shaul et al.2, Methods). Expression score per cell is the geometric mean normalized expression level (TPMs) across all signasture genes, corrected by subtraction of the geometric mean expression of a random set of genes of similar expression levels (Methods). (d) Recently activated pyramidal neurons. Left: Dot plot as in (c) showing the expression of immediate early genes (IEGs) across all clusters (as in Fig. 1b), showing cluster 23, capturing pyramidal neurons expressing IEGs. Right: tSNE plot of all cells, color coded by the expression level of the Egr4 gene in CA3/CA1/Subiculum (cluster 23), and DG excitatory neurons (part of cluster 12). (e) Cell type specific markers. Dot plots showing the expression level (color scale) and the percent of cells expressing (dot size) genes across all clusters (rows, as in Fig. 1b), showing markers found to be specific to cells classified as (from left to right): ependymal/NPCs, fibroblasts and pericytes.

