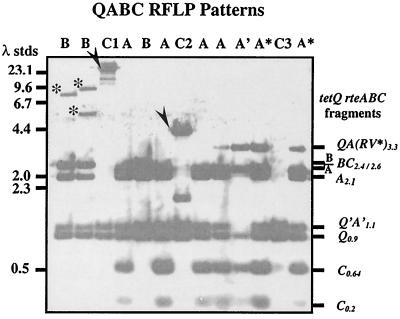
FIG. 2.
Southern blot of the EcoRI- and EcoRV-digested cellular DNA from tetQ-containing Bacteroides isolates. The blot was first probed with an rteC probe and then reprobed with the tetQ-rteA-rteB-rteC-containing probe. The blot is overexposed so that the small rteC-containing bands (C0.2 and C0.64) can be observed for pattern A. These sequences appear in the BC2.6 band of pattern B. The sizes of the HindIII lambda DNA size standards (stds) are given on the left. The sizes and contents of the major bands hybridizing to the probes are shown on the right. A schematic of the region being probed and the expected sizes is shown in Fig. 1. The patterns for each lane are labeled according to the scheme described in Fig. 1. The rteC-containing fragments for patterns C1 and C2 are indicated by arrows. These fragments also contain rteB, and C2 is for CTnV479. The B patterns in lanes 1 and 2 also contain extra hybridizing bands (indicated by asterisks) that hybridize to rteB but not rteC or tetQ probes. The A* patterns may be due to a strain containing both an A and an A′ CTn as is seen for B. fragilis ERL or the pattern may be due to partial digestion of the EcoRV site between tetQ and rteA (Fig. 1), as is sometimes observed for CTn12256 (data not shown).

