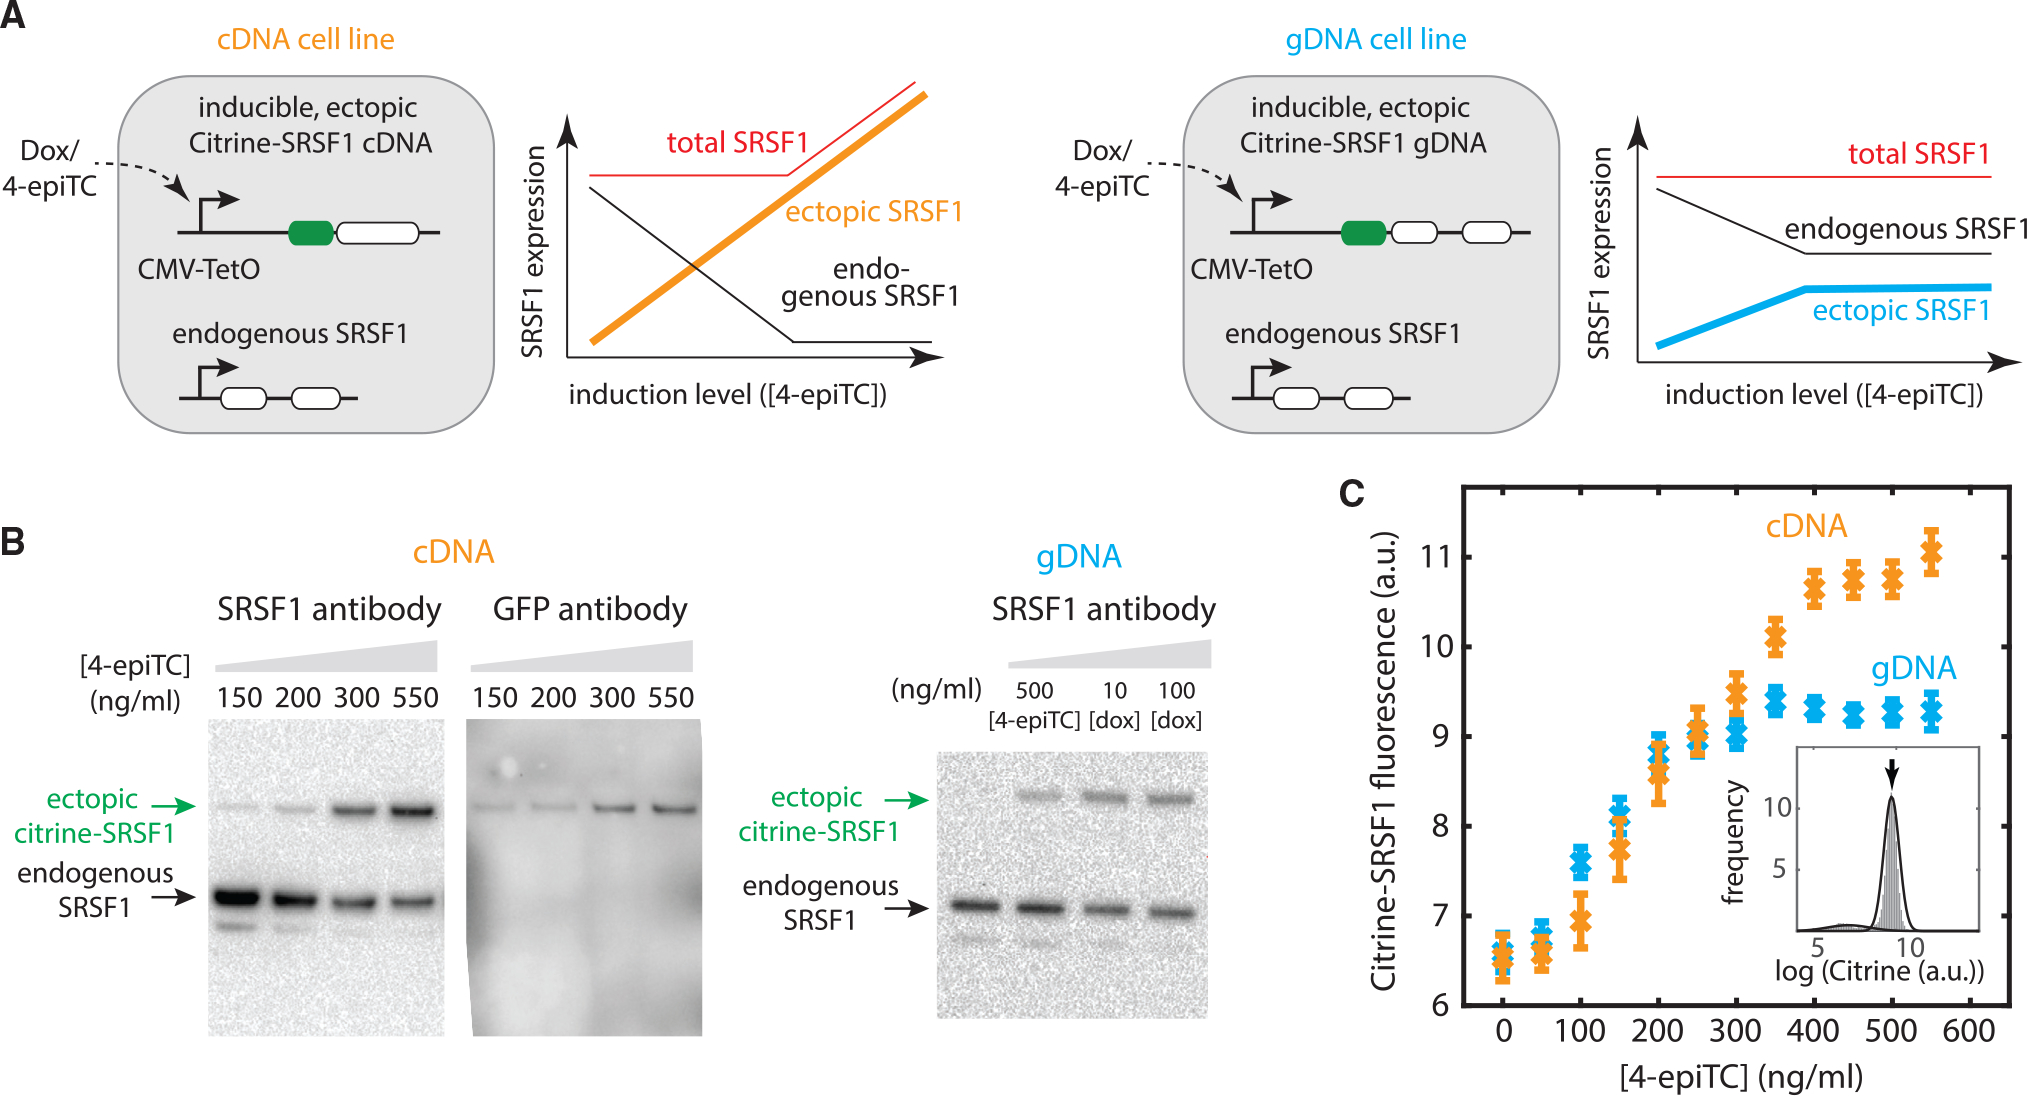
Figure 2. Negative splicing autoregulation establishes a ceiling for SRSF1 protein concentration in response to its own pre-mRNA substrate perturbations.

(A) We designed two cell lines: one transfected with a Citrine fused SRSF1 cDNA (i.e., unregulated, with no intron, shown in orange), the other transfected with a Citrine-fused genomic SRSF1 DNA (i.e., autoregulated, shown in blue), both under an inducible Tet-On CMV promoter and stably integrated into the fixed locus of Flp-In T-REx HEK293 cell lines (top). (Bottom) Expected outcomes (schematic): For the cDNA version, increasing ectopic SRSF1 protein level should downregulate endogenous SRSF1 production via splicing feedback (black curve). When the endogenous copy saturates its ability to buffer SRSF1 overexpression, the total SRSF1 level overshoots (red curve). By contrast, for the gDNA cells, due to the negative splicing autoregulation of both the ectopic copy (blue curve) and endogenous copy (black curve), the total SRSF1 level should remain constant (red curve), across a broader range of induction levels.
(B) Western blot shows that the endogenous SRSF1 level decreases with the increasing expression of the ectopic copy. We induced cDNA cells at different 4-epiTC (an analog of doxycycline [dox], with weaker affinity) concentration for 24 h. Anti-SRSF1 antibody (ab133689) staining shows 2 bands: the top band indicates the ectopic copy with fused Citrine (verified by staining Citrine using anti-GFP monoclonal antibody [right]), the bottom band indicates the endogenous copy. Western blot of gDNA cells (induced at different 4-epiTC/dox concentration for 24 h) is also shown as a comparison.
(C) Flow cytometry data shows that ectopic SRSF1 reaches a ceiling (blue curve) with negative splicing autoregulation (i.e., gDNA version), but not with the cDNA version. The 2 cell lines (A) were induced at different 4-epiTC concentration for >24 h and analyzed by flow cytometry. Mean expression levels were extracted from Gaussian fits (Figure S3) to represent the ectopic SRSF1 level. Error bars represent the standard error of the mean from 9 experimental replicates.
