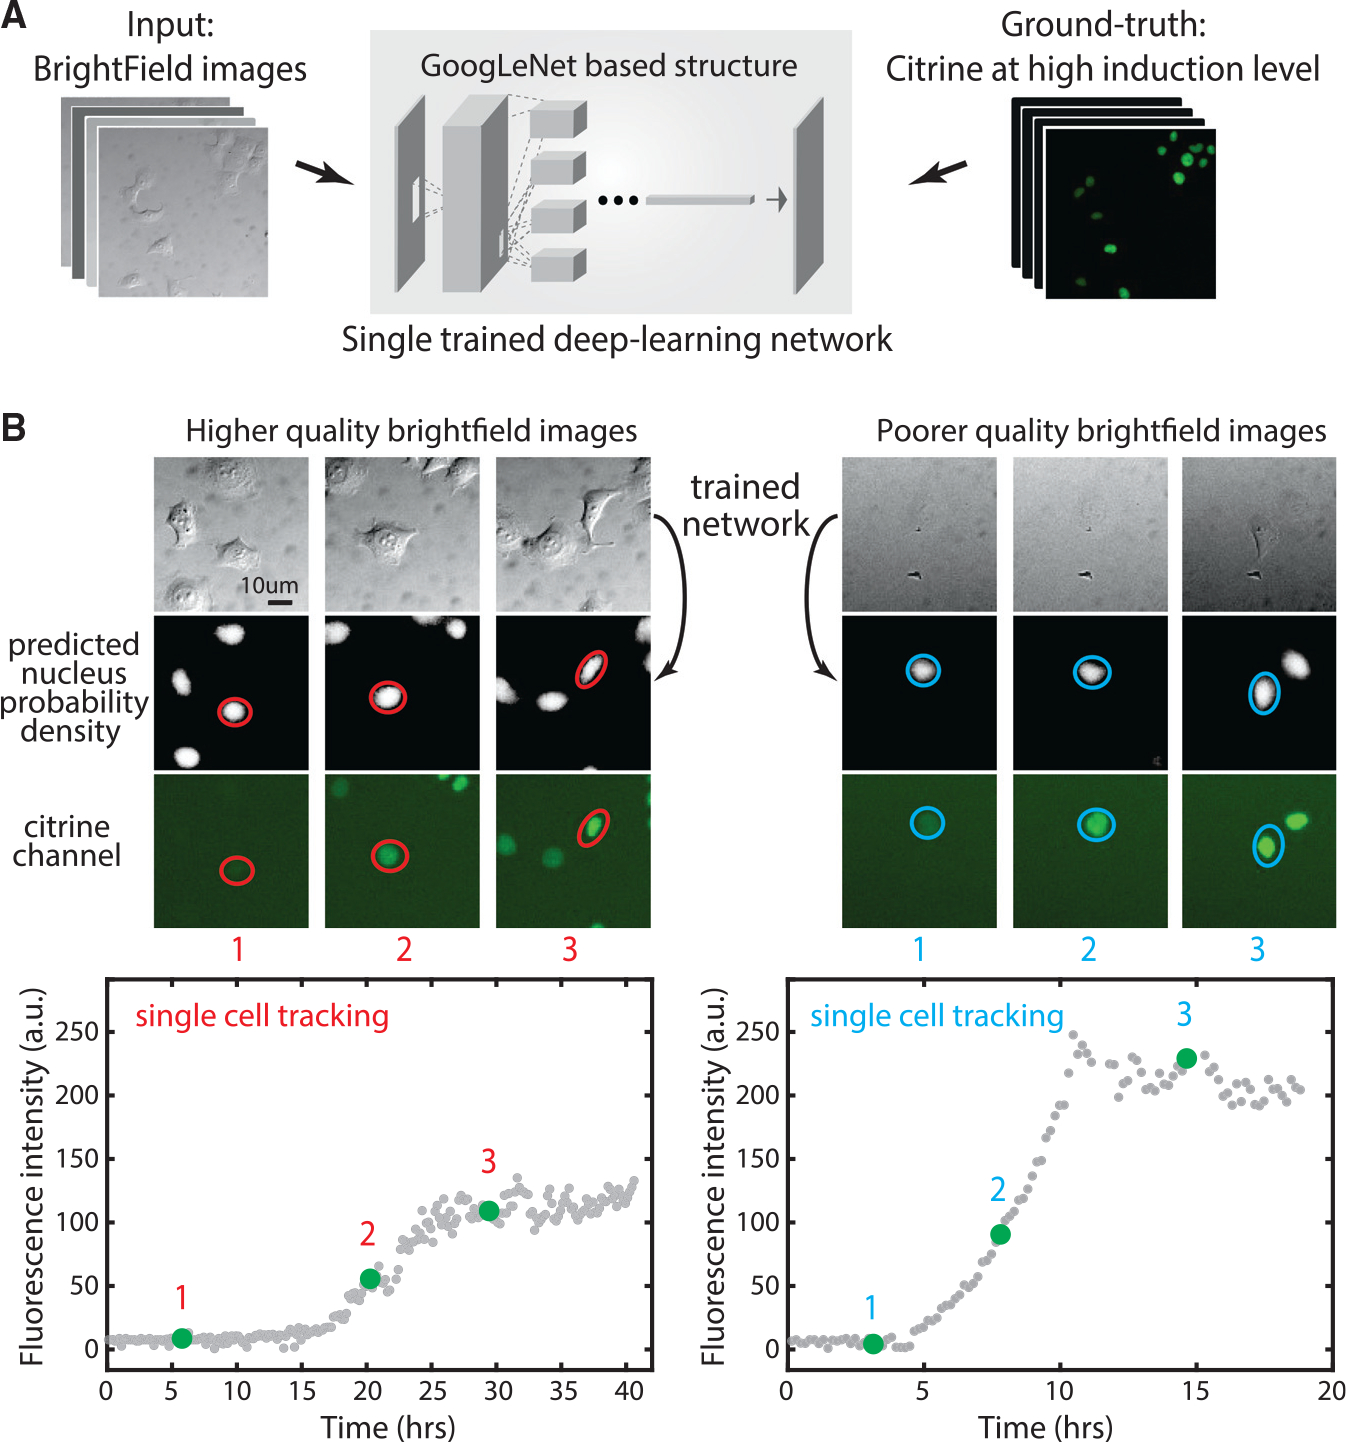
Figure 3. Deep-learning network enables tracking of SRSF1 accumulation in individual cells over time.

(A) We trained a single deep learning network using ~150 bright-field (DIC) images with their correspondent Citrine signal as the ground truth for learning nuclear location.
(B) The trained network predicts nucleus images (center row) from bright-field images (top row) for 2 different example time-lapse single-cell traces (left and right panels). Note the similarity of predicted fluorescence and actual fluorescence on later images, where visible. Time points are indicated by red/blue numbers (compare with real-time tracking video curves at the bottom). Two videos show diverse bright-field background and contrast, but our trained network works on both. Red circles represent cell segmentation based on deep learning predicted nuclear probability. Left and right traces are the SRSF1(cDNA) cell line induced at t = 0 with 200 ng/mL 4-epiTC or 100 ng/mL dox, respectively.
