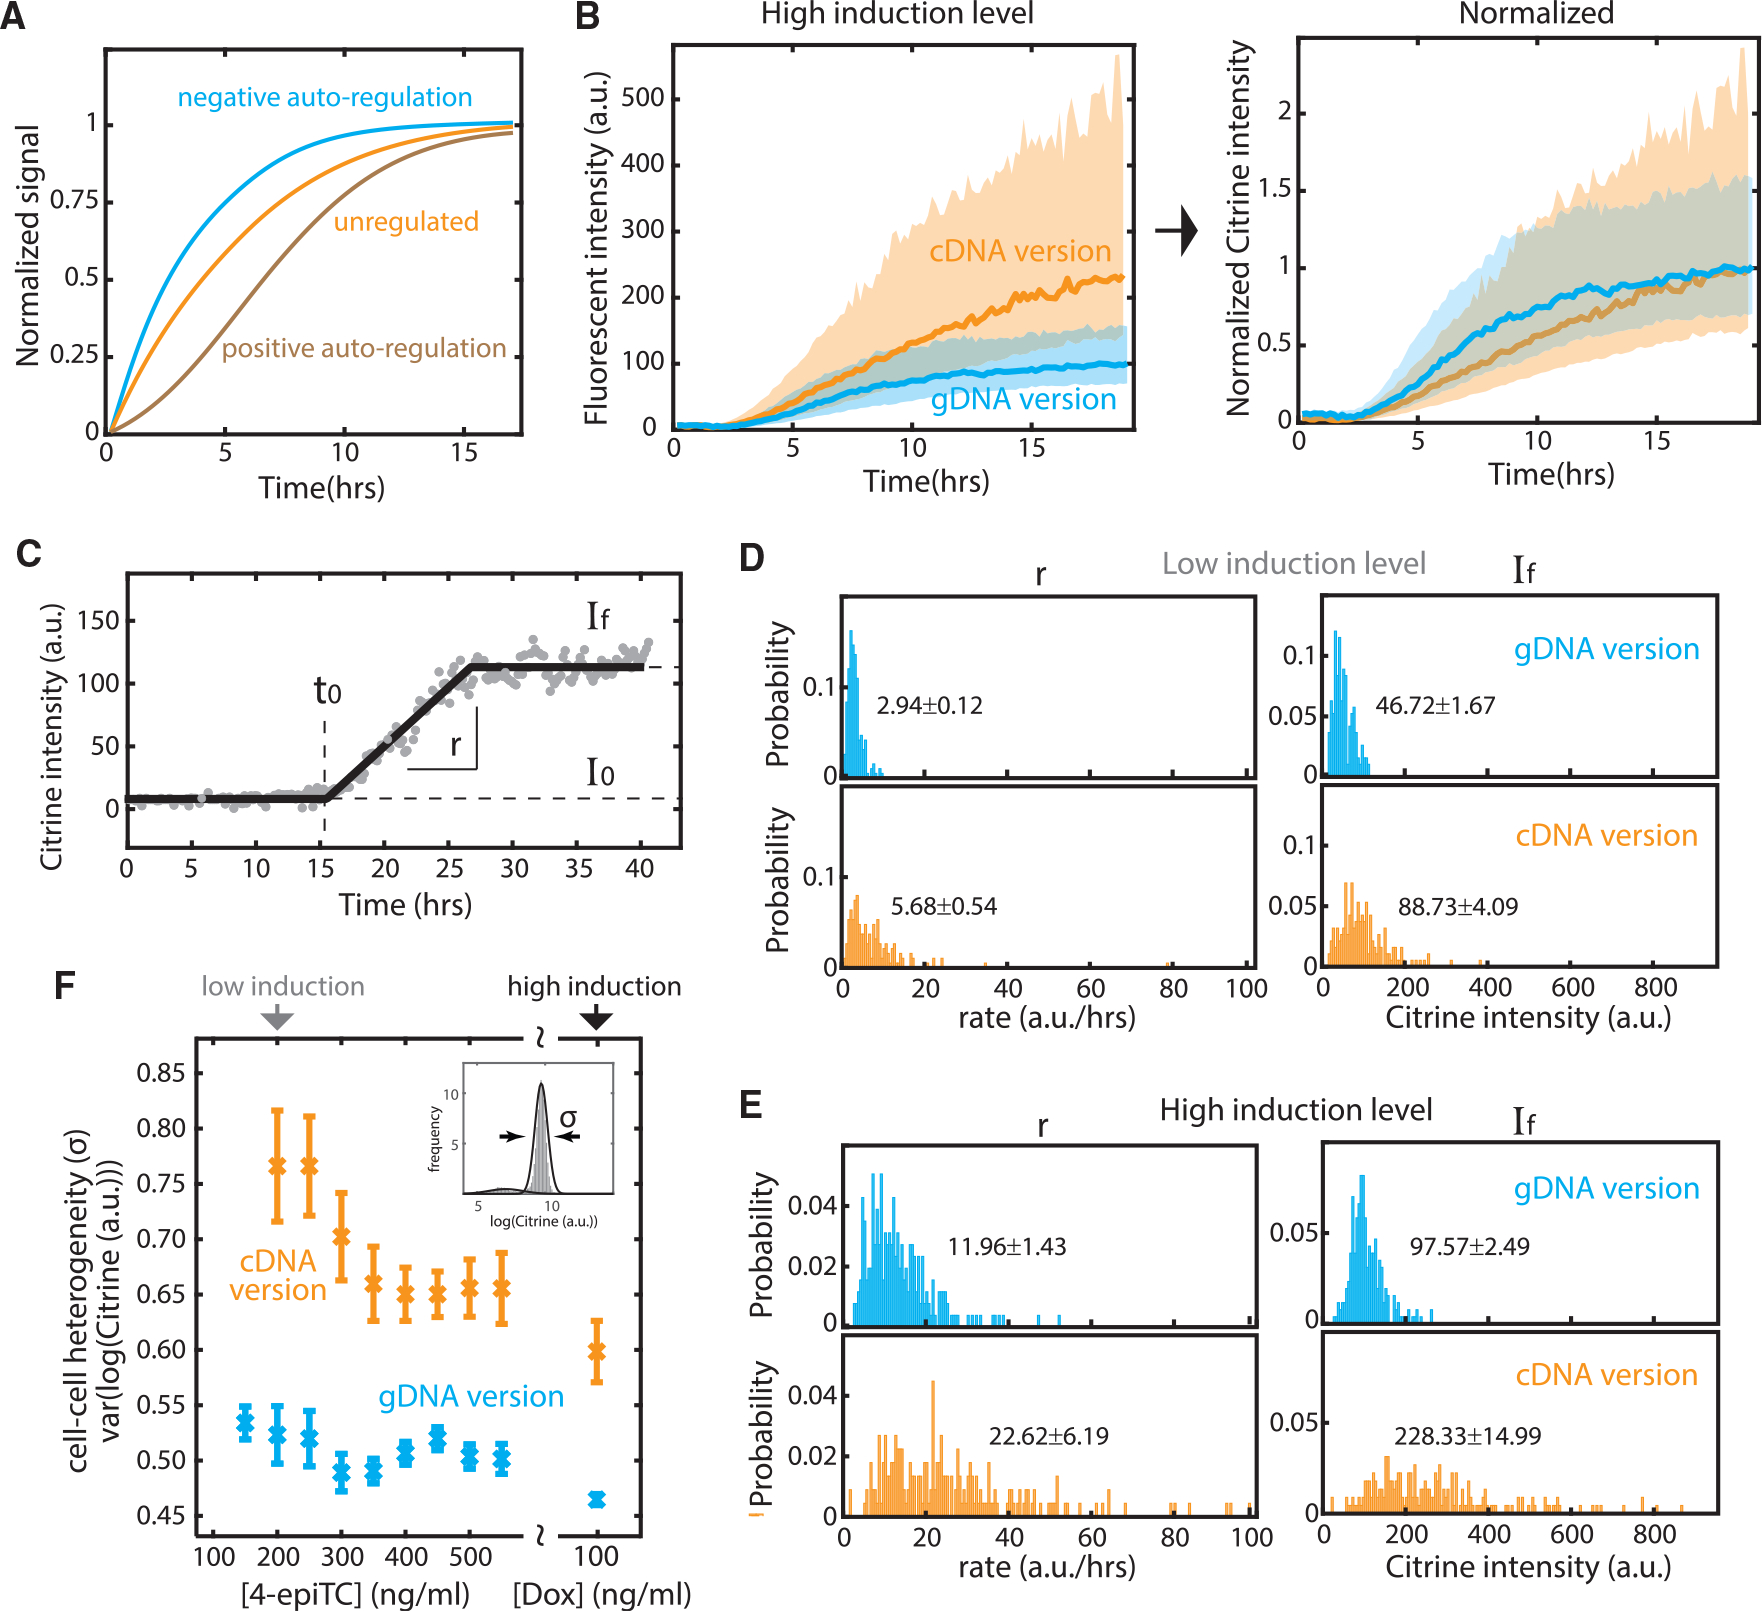
Figure 4. Splicing negative autoregulation reduces cell-cell heterogeneity in both the level and response rate of SRSF1 protein.

(A) Negative feedback accelerates response time, in comparison to unregulated or positive feedback (schematic).
(B) Negative autoregulatory splicing speeds response rate and reduces cell-cell heterogeneity at high induction level (100 ng/mL dox). (Left) Solid curves are the median of 257 SRSF1(cDNA) and 223 SRSF1(gDNA) single-cell traces. The shade represents the standard deviation of the mean. (Right) The curves are normalized to final expression.
(C) We fit 4 parameters to characterize time-lapse video traces. I0 represents background Citrine intensity and auto-fluorescence. If represents the final (steady-state) Citrine level. t0 denotes the time point when Citrine signal (i.e., ectopic SRSF1 level) surpasses background. r represents the response speed (slope) from I0 to If. The example video trace is the same as in Figure 3 (left).
(D) Distributions of rate and final intensity for 191 gDNA and 188 cDNA traces with 200 ng/mL 4-epiTC added at t0 (see I0 and t0 distribution in Figure S4).
(E) Similar distributions for gDNA and cDNA traces with 100 ng/mL dox added at t0 (see I0 and t0 distribution in Figure S4). The labeled text denotes the median and the standard error of the mean. At both induction levels, the autoregulatory (gDNA) system exhibits a tighter distribution of final equilibrium SRSF1 levels and response rates. The negative splicing feedback loop thus reduces cell-cell heterogeneity both in final level and dynamics.
(F) Flow cytometry data confirms that the autoregulatory (gDNA) system exhibits lower cell-cell heterogeneity across a wide range of induction levels. As in Figure 2C, we induced gDNA and cDNA cells for >24 h, fit the Citrine intensity with a Gaussian curve (Figure S3), and used the standard deviation parameter from the Gaussian fit to represent the variance of ectopic SRSF1 level between cells. Error bars represent the standard error of the mean from 9 experimental replicates.
