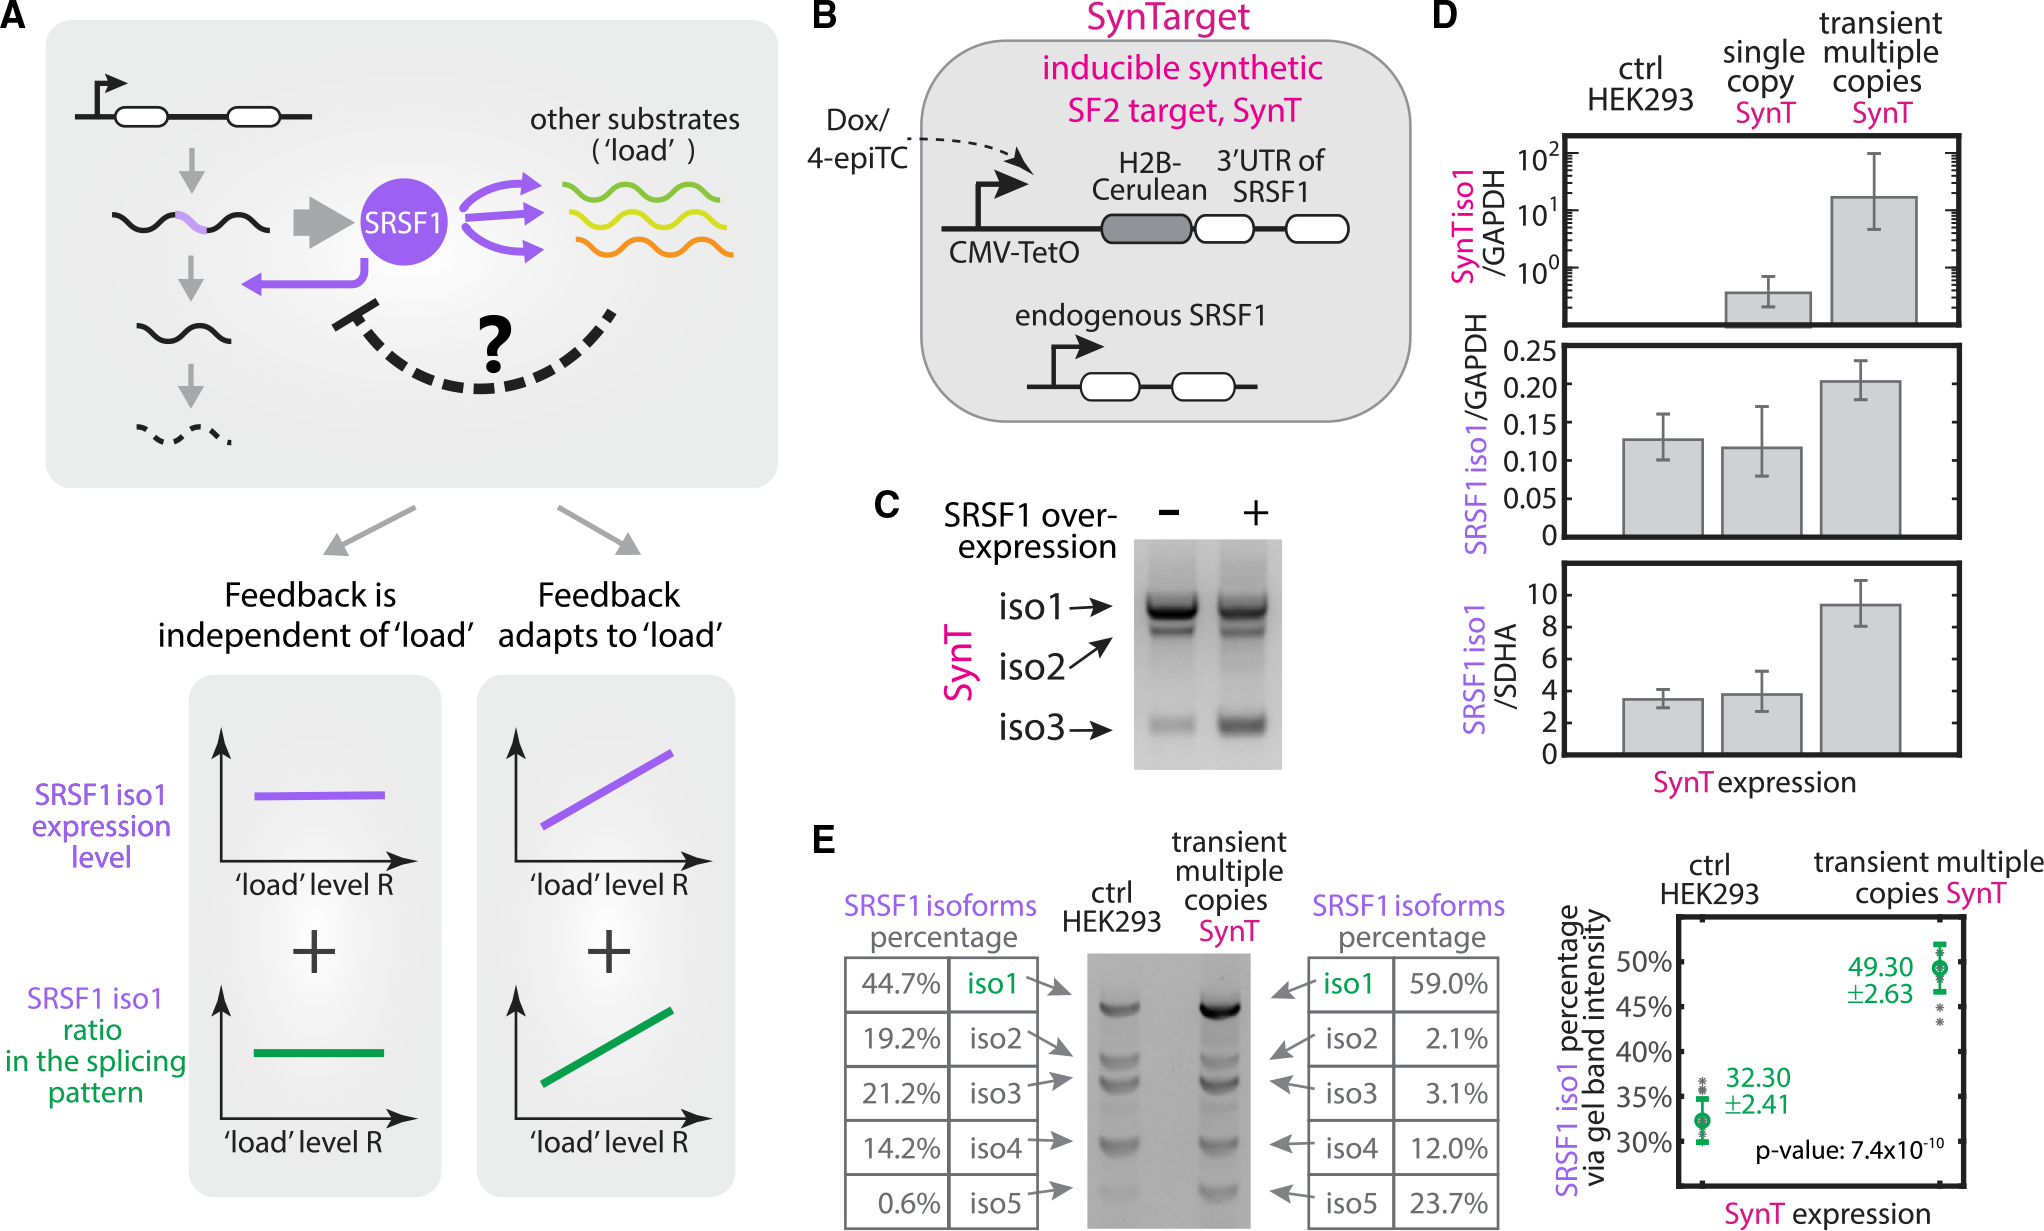
Figure 5. Splicing negative autoregulation modulates its feedback strength in response to variable total substrate load.

(A) Two possible outcomes in response to total substrate load. (Left) Robust feedback scheme: The total SRSF1 level (purple line) and its splicing pattern (green line) remain constant across a broad range of substrate levels. The amount of SRSF1 involved in negative feedback is independent of load level. (Right) Adaptive feedback scheme: more SRSF1 is produced (purple and green curves) via weakening negative autoregulatory splicing (i.e., dashed negative arrow in the top gray box), as increased substrate load titrates away available SRSF1 in the cell.
(B) The inducible synthetic SRSF1 target (SynTarget [SynT]) cell line contains H2B-Cerulean fused with the spliceable 3′ UTR of SRSF1. This synthetic gene is expressed under a Tet-On CMV promoter and stably integrated at the Flp-In locus in a T-REx HEK293 cell line.
(C) SynT is a splicing target of SRSF1. We used RT-PCR and gel-imaged 3 isoforms of SynT cells with 100 ng/mL dox (left lane) and of SynT cells with transiently transfected SRSF1(cDNA) plasmid in 100 ng/mL dox (right lane). We found that SRSF1 overexpression promotes the splicing of SynT, increasing the expression of short isoforms.
(D) We induced SynT at different levels and quantified the concentration of SynT isoform 1 (top row) and the functional SRSF1 isoform 1 (bottom 2 rows) by qRT-PCR (see qPCR qualification in Figure S6). We found that SRSF1 levels remained unchanged by expression from a single copy of SynT (center column, by inducing the stably integrated SynT with 100 ng/mL dox), but increased ~50% when multiple SynT copies were induced in the same cell (right column, by transiently transfecting SynT plasmid with 100 ng/mL dox). qPCR results were verified by normalizing to 2 housekeeping genes, GAPDH and SDHA, respectively. The data represent the exponential logarithmic mean of normalized qPCR reads. Error bars represent the minimum and maximum values over 3–10 experimental replicates.
(E) SRSF1 splice isoform pattern changes in response to increased total substrates. We quantified SRSF1 isoforms using RT-PCR and analyzed the gel band intensity by Bio-Rad ChemiDoc Image Lab 6.0 band analyzer. Two gel band examples are presented—one from HEK293 control (left), the other from transient multiple copies of SynT (right). Multiple copies of SynT trigger ~50% more SRSF1 isoform 1 (i.e., functional unspliced isoform) through splicing. The data represent the median of gel band intensity percentage reads and error bars represent the standard deviation over 6–7 experimental replicates.
