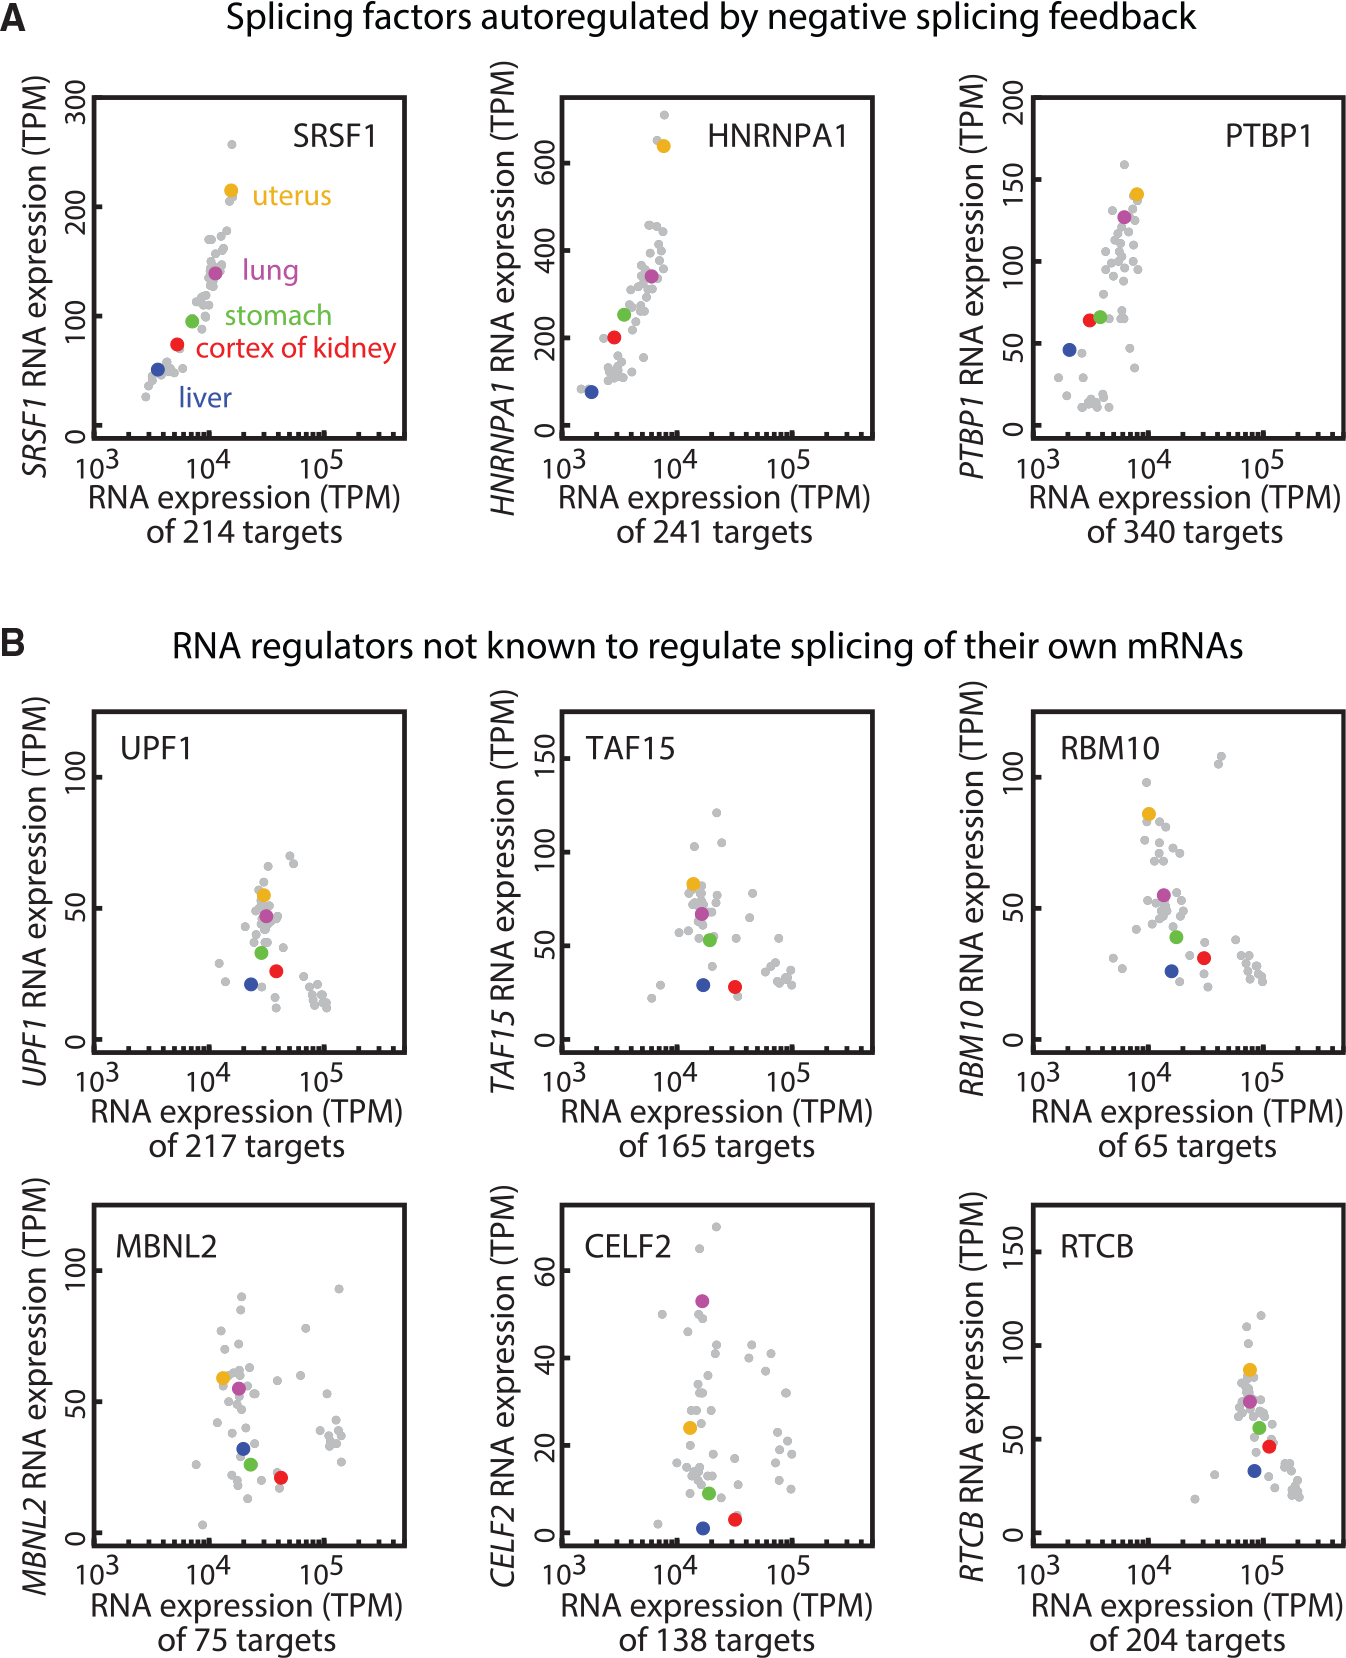
Figure 6. The adaptation function of splicing negative autoregulation responds to variations in endogenous targets load.

(A) The expression level of splicing factors positively correlates with their target expression across 53 human tissue types (gray dots), in which 5 example tissues (uterus, lung, cortex of kidney, stomach, liver) are labeled in distinct colors. The splicing factor RNA expression levels (TPM) were extracted from the GTEx database. The respective target genes are selected based on POSTAR2, specifically, the top 2% “binding site records” in each CLIP database (STAR Methods). The 3 splicing factors SRSF1, hnRNPA1, and PTBP1 are autoregulated via negative splicing feedback.
(B) The RNA regulation proteins not known to regulate splicing of their own mRNAs do not show correlative patterns as in (A).
