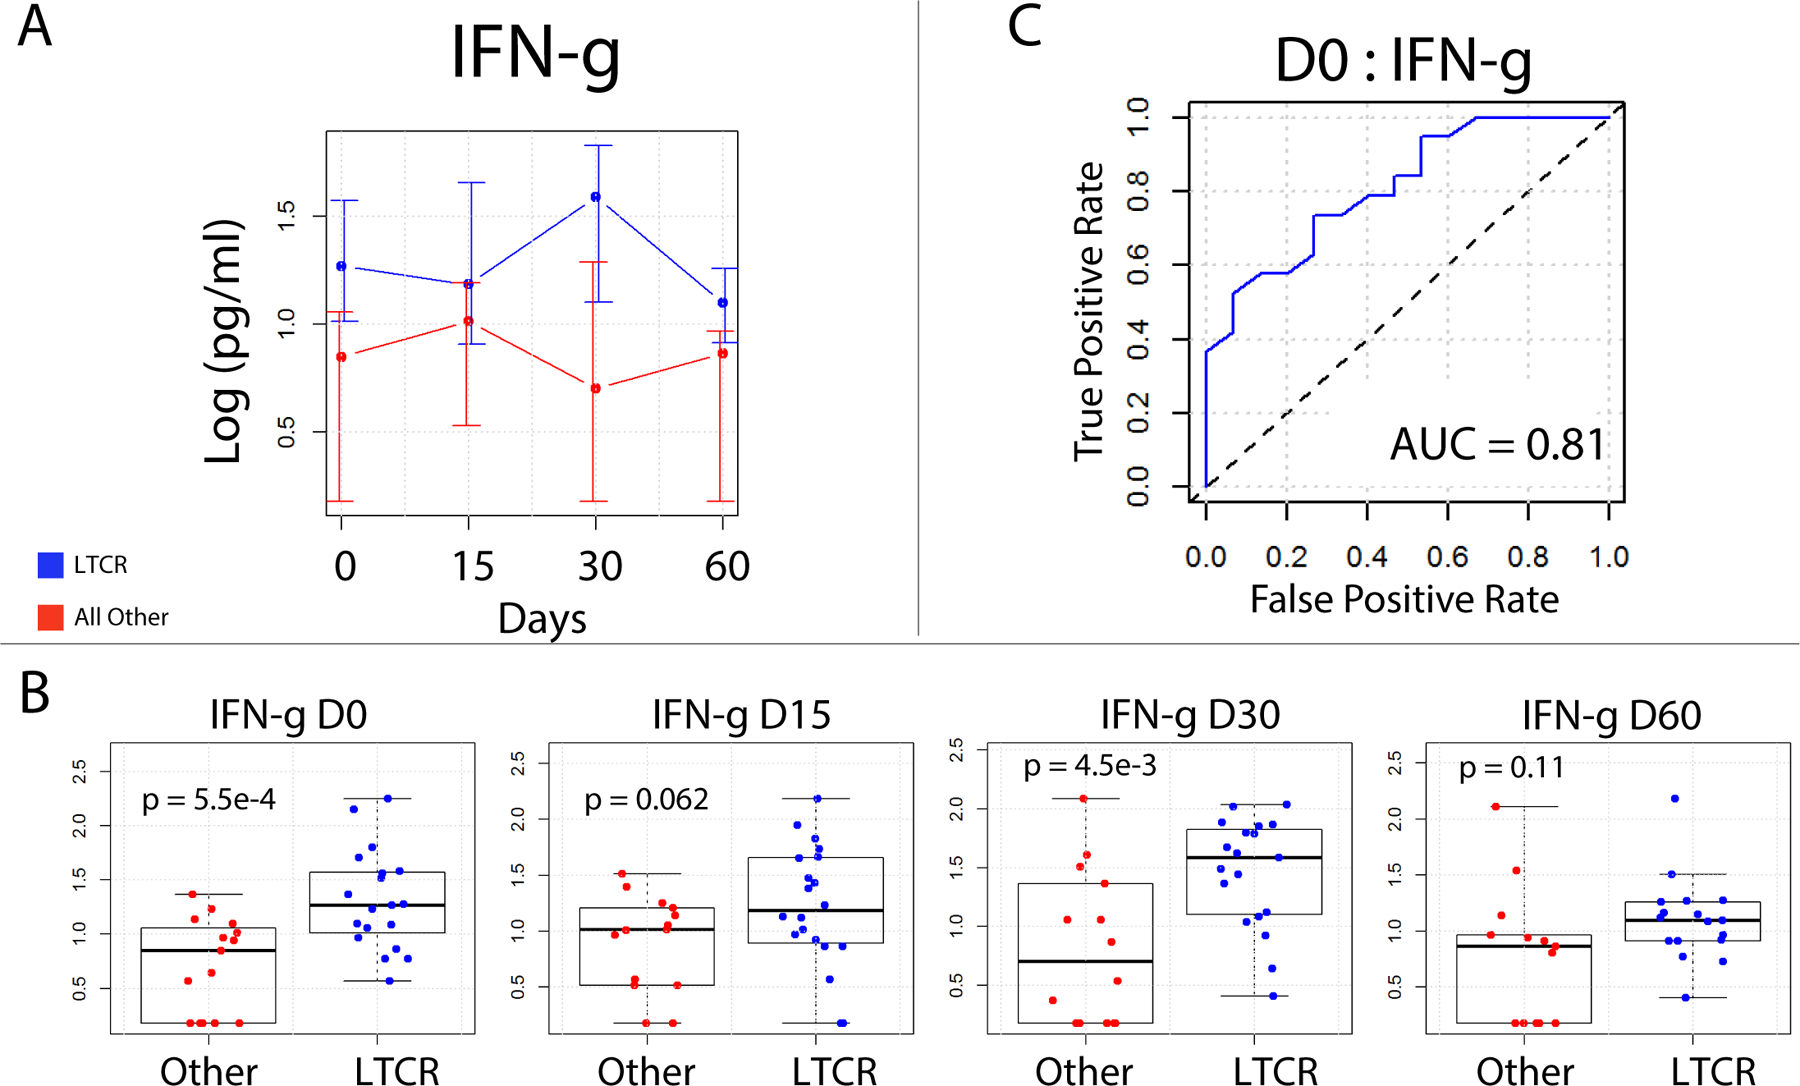
Figure 2.

IFN-γ Long term complete responder (LTCR) (blue) versus all others (red) - Plasma was assayed for IFN-γ using the luminex platform. A) Line graph of plasma IFN-γ over time reveals that LTCR tend to have higher plasma IFN-ˠ. Displayed are log median values with error bars indicating 75th and 25th percentiles. B) Individual patient values presented as Box whisker plots over time. The IFN-γ difference between LTCRand all others was most significant on Days 0 and 30, Unpaired Student’s t test. C) Receiver operator characteristic curve for baseline IFN-ˠ values, complete responders versus partial responders. An AUC of 0.81 demonstrates the utility of baseline IFN-ˠ plasma levels as a classifier to identify complete responders from partial responders.
