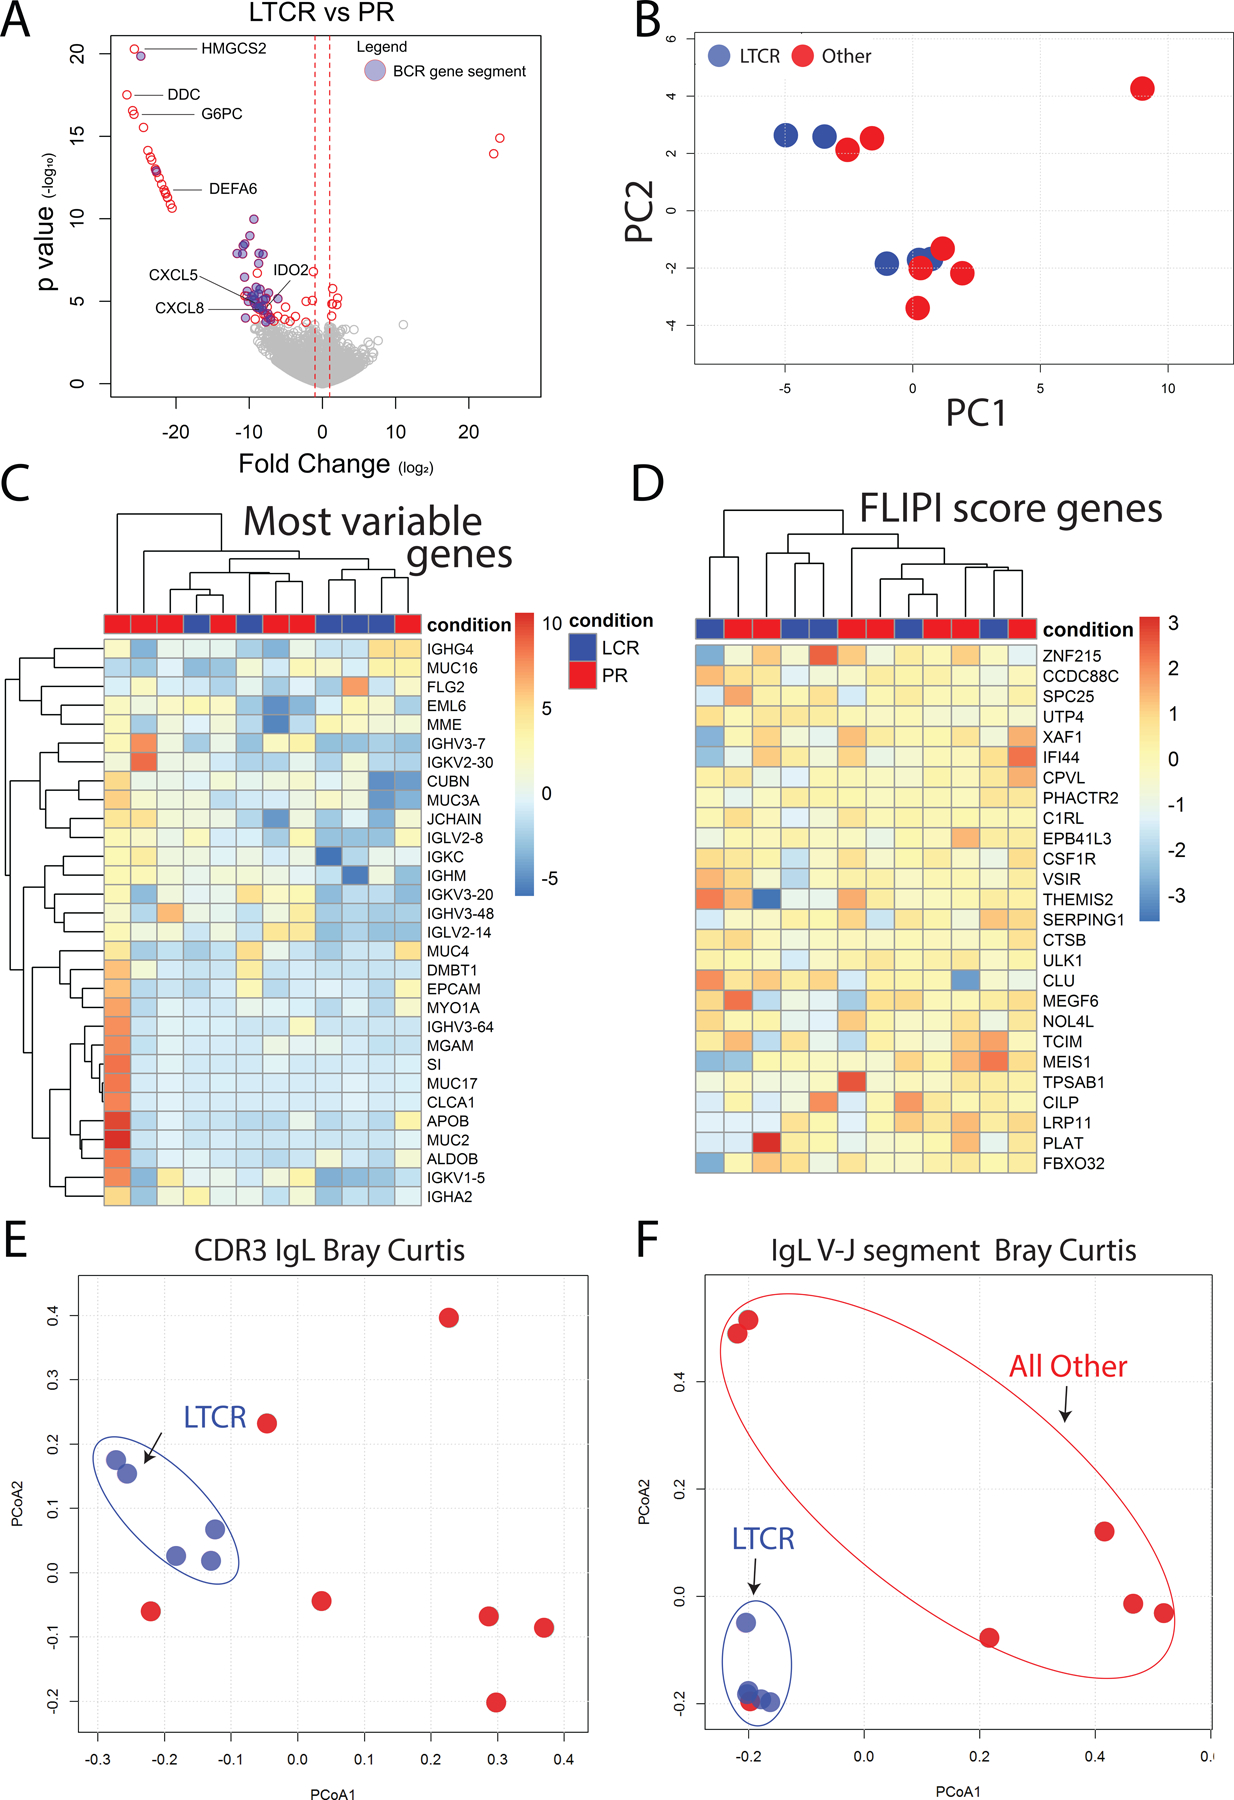
Figure 5.

RNA-Seq analysis of pretreatment lymphoma. (A) Volcano plot of differentially expressed genes between long-term complete responders and partial responders (for complete list see Supplemental Table 3). Blue circles indicated differentially expressed BCR gene segments. (B) Principal component analysis based on RNA-Seq gene expression fails to separate long-term complete responders and partial responders. (C) Hierarchical clustering of patients based on the 30 most differentially expressed genes. Long-term complete responders are shown in blue and partial responders in red. For each gene, the intensity of color represents gene expression with red representing higher expression and blue representing lower expression. (D) Hierarchical clustering of patients based on the previously identified 26 genes that separate diffuse large B cell lymphoma patients into “low immune” and “immune-high” subgroups. Again, there is no separation of long-term complete responders and partial responders (E) To visualize BCR repertoire similarity between LTCR and partial responders a PCoA plot of CDR3 Bray Curtis distances of Ig light chains was constructed. Blue circles represent LTCR. (F) PCoA plot of Bray Curtis distances of V-J Ig light chain gene segment usage, again revealing that LTCR cluster together.
