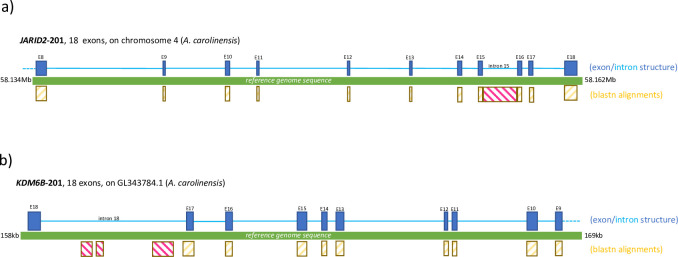
Fig 3. Exon and intron structure of differentially expressed isoforms of JARID2 and KDM6B.
a) Diagram of the exon/intron structure of the JARID2 isoform from B. vittatus that is over-expressed at 26°C. Exons are shown as dark blue rectangles, introns are shown as light blue lines. BLASTn matches to exonic sequences are shown as yellow rectangles, whereas matches to intronic sequences are indicated by pink rectangles. The green bar represents the reference genome of A. carolinensis. BLASTn alignments were performed against this reference genome. b) Same as in a) but for the KDM6B isoform from B. vittatus that is over-expressed at 26°C.

