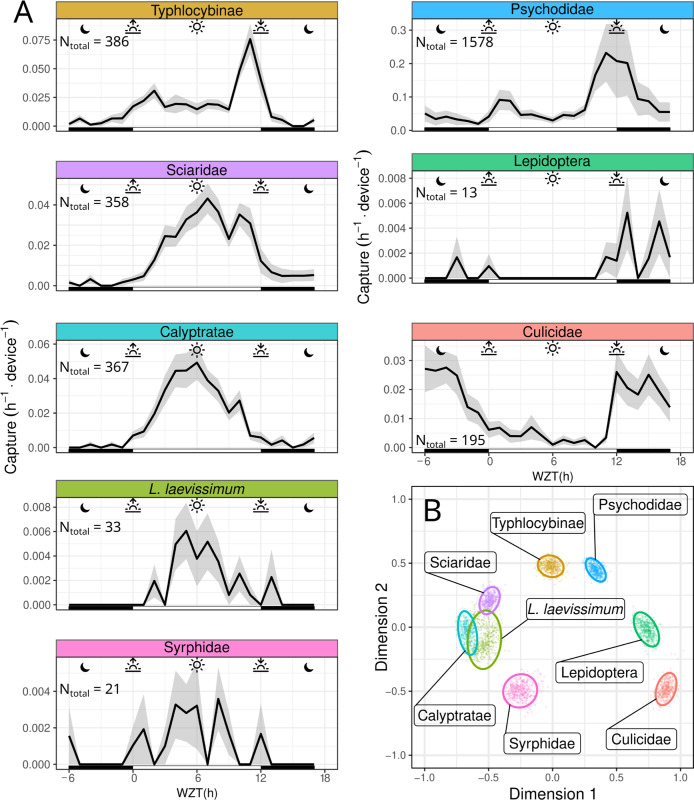
Fig 6. Sticky Pi reveals community chronoecology.
In order to assess the activity pattern of a diverse community, we deployed 10 Sticky Pis in a raspberry field for 4 weeks, replacing sticky cards weekly. This figure shows a subset of abundant insect taxa that were detected by our algorithm with high precision (see Supporting information for the full dataset). (A) Average capture rate over time of the day (note that time was transformed to compensate for changes in day length and onset—i.e., Warped ZT: 0 h and 12 h represent the sunset and sunrise, respectively. See Methods section). (B) MDS of the populations shown in A. Similarity is based on the Pearson correlation between the average hourly activity of any 2 populations. Small points are individual bootstrap replicates, and ellipses are 95% confidence intervals (see Methods section). Insect taxa partition according to their temporal activity pattern (e.g., nocturnal, diurnal, or crepuscular). Error bars in A show standard errors across replicates (device×week). Individual facets in A were manually laid out to match the topology of B. The underlying data for this figure can be found on figshare [20]. MDS, multidimensional scaling; ZT, Zeitgeber time.

