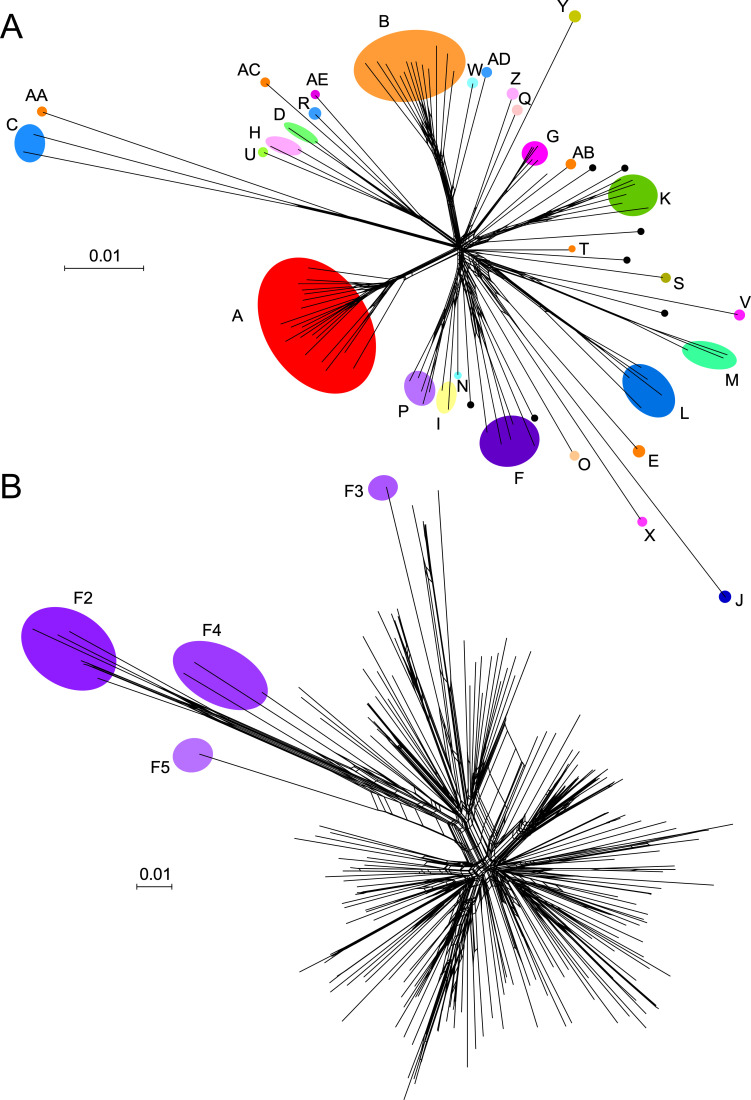
Fig 2. Diversity of mycobacteriophage genomes displayed as network phylogenies based on shared gene content.
(A) Relationships among representative members of clusters, subclusters, and singleton genomes. One member of each mycobacteriophage cluster and subcluster together with the 7 singletons were compared using Splitstree [39] with a nexus file recording the numbers of shared genes. Clusters are illustrated with colored shading; note that some clusters (e.g., Cluster A) contain several subclusters indicated as nodes, whereas other clusters are not subdivided. Singletons are shown as unlabeled black circles. (B) Diversity of Cluster F mycobacteriophages. All currently sequenced Cluster F mycobacteriophages (n = 188) are displayed as nodes in a network phylogeny using Splitstree. Colored circles show the positions of the Subclusters F2 to F5 genomes; all of the others (n = 177) are grouped in Subcluster F1. This illustrates the substantial intracluster diversity, and pairwise comparisons of Subcluster F1 phages show they may share as few as 40% of their genes.

