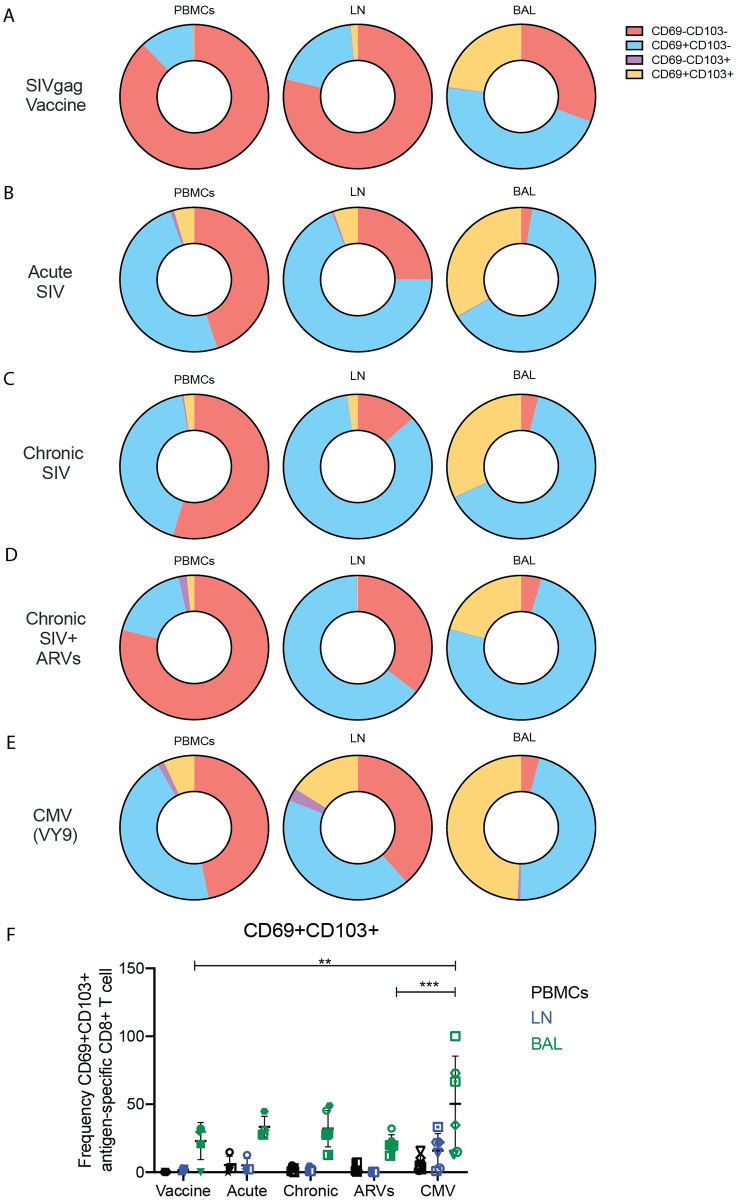
Fig 6. Expression patterns of CD69 and CD103 among virus-specific CD8+ T cells.
The expression of CD69 and CD103 on antigen specific CD8+ T cells were assessed by flow cytometry across all experimental groups. (A-E) Average percentage of CD69-CD103-, CD69+CD103-, CD69-CD103+ and CD69+CD103+ antigen-specific (CM9) CD8+ T cells after exposure to SIV-gag DNA vaccine (A); during acute (B), chronic (C), and chronic SIVmac239X or SIVmac239 infection with ARV treatment (D); or during CMV infection (E). (F) The number of CD69+CD103+ antigen-specific CD8+ T cells during all experimental conditions. In (F) data are presented as mean with SD. Two-way ANOVA was used to determine statistical significance in (F). n = 3 to 6 animals.

