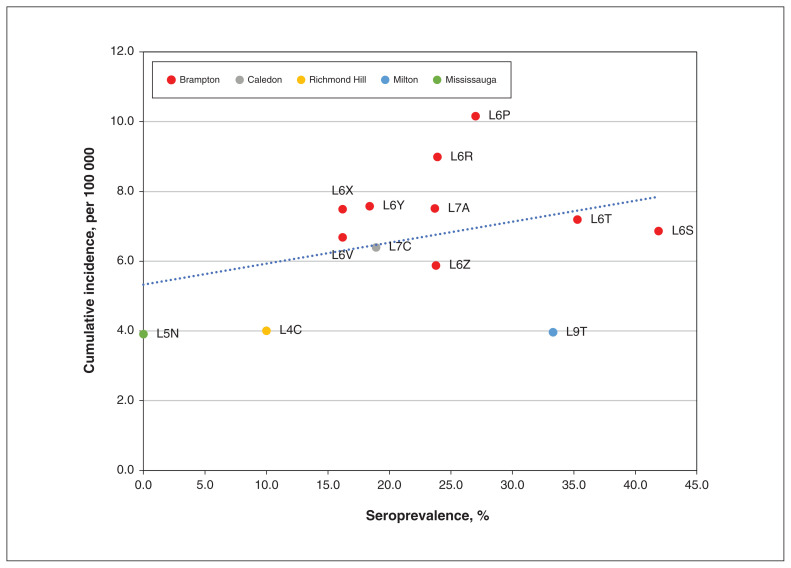
Figure 2:
Cumulative incidence of cases of SARS-CoV-2 infection (per 100 000) as of Oct. 3, 2021, by seroprevalence by geographic region (forward sortation area). Cumulative incidence data from ICES.18 Seroprevalence data from the COVID CommUNITY study.

