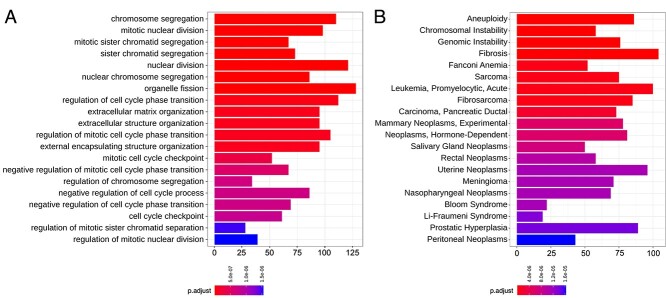
Figure 2.
Barplots of ORA show mainly BS-related terms in the top 20 denominations when the gene expressions of the BS patient fibroblasts and the WT fibroblasts were compared. (A) Top 20 differentially expressed GO terms were obtained via ORA from the R-package clusterProfiler (71). (B) The top 20 MeSH (26) obtained by ORA as in (A). Most of the GO terms and all of the top 20 MeSH nominations were linked to BLM dysfunction and BS pathogenesis. The x-axis shows the number of significantly deregulated genes on each denomination. The adjusted P-value calculation was done by using the Benjamini–Hochberg procedure for each P-value (70).

