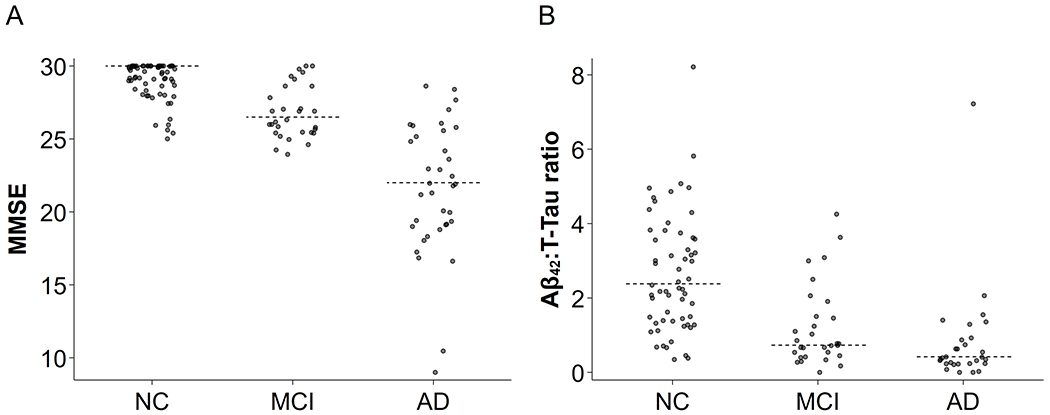
Fig. 1.

Distributions of MMSE and Aβ42:T-Tau ratio with AD progression. The diagnosis groups trend as expected for measures of disease severity: average MMSE (A) was decreased modestly in MCI and dramatically in AD, and average Aβ42:T-Tau ratio (B) was much lower for MCI and AD than for NC. For both, the MCI profile was intermediate to the NC and AD profiles. Individual participants denoted by points and dotted lines represent group medians. The trend of medians was very apparent for both measures.
