
Fig. 2.
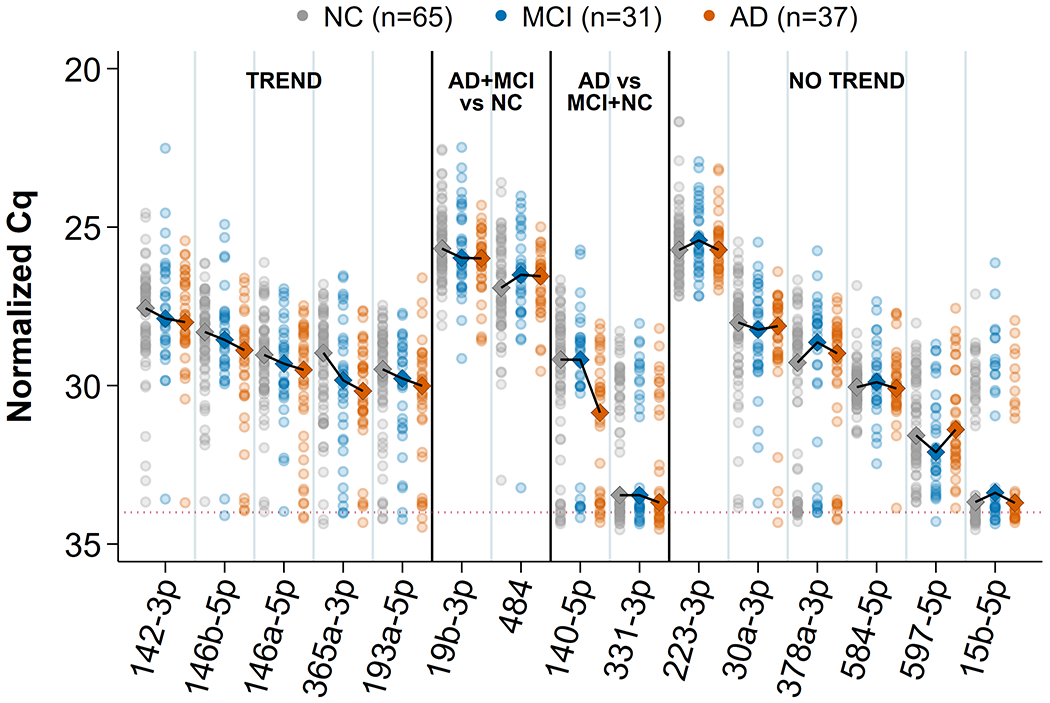
Trend plots of 15 validated miRNAs. All normalized Cq values for samples and median profile across groups are shown for each of the 15 miRNAs that remained viable for this study. The connected diamonds represent medians for 4 kinds of apparent profiles: linear (“TREND”), two kinds of nonlinear (“AD+ MCI versus NC” and “AD versus MCI + NC”), and an ambiguous profile showing a lack of natural diagnosis ordering (“NO TREND”). Multivariate correlation of the trending miRNAs with diagnosis order was −0.36 (p = 0.003).