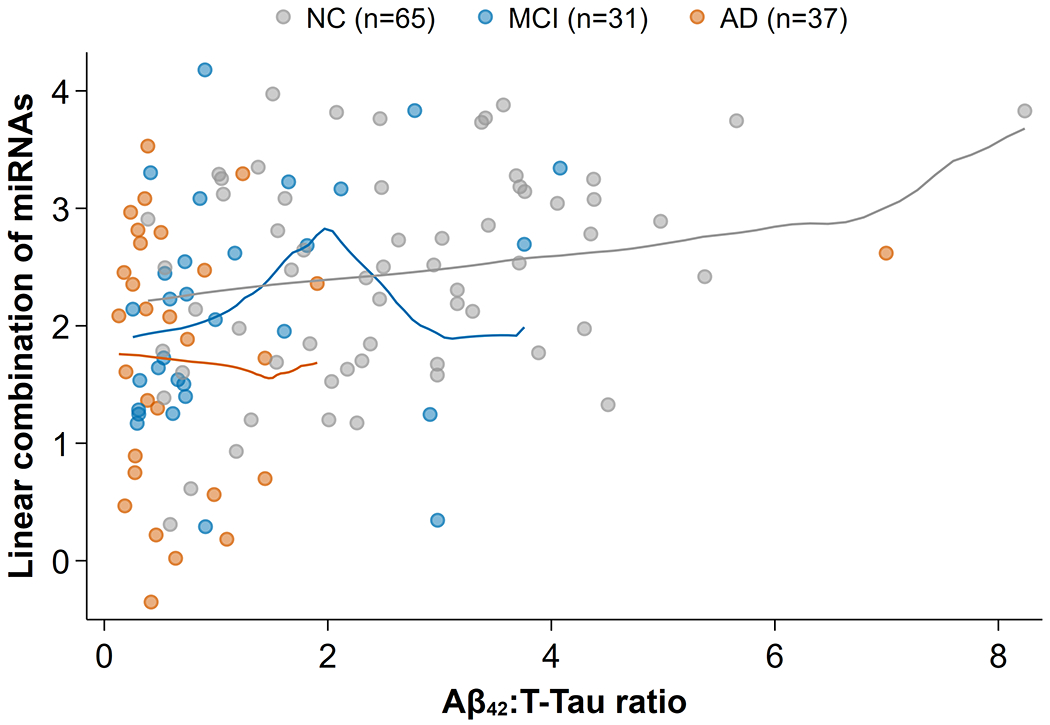
Fig. 4.

Weak correlation between Aβ42:T-Tau and five trending miRNAs for MCI. The canonical linear combination of miRNAs (i.e., the linear projection of miRNA expression values that best predicts Aβ42:T-Tau) is shown against Aβ42:T-Tau levels. What correlation exists (0.38) was primarily due to a modest trend in control samples (gray). In the “diseased” range of Aβ42:T-Tau between 0 and 2, where most of the AD(orange) and MCI(blue) samples lie, there was no appreciable correlation (0.17) between the trending miRNAs and Aβ42:T-Tau levels. Lines show the empirical trends: for NC there was a weak, but consistent positive relationship, and for AD and MCI the lines show random sampling fluctuations, but no apparent correlation.
