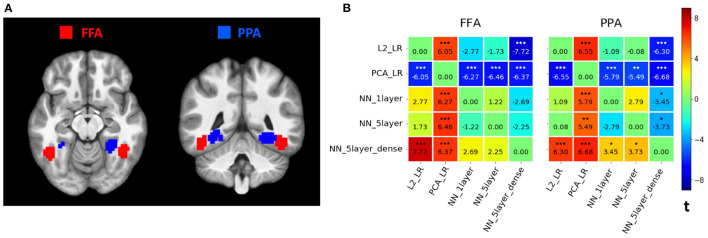
Figure 2.
(A) Seed regions. Example seed regions for one representative participant. The fusiform face areas (FFA) are shown in red, and the parahippocampal place areas (PPA) are shown in blue. Individual ROIs per participant were defined based on first-level t-maps, identifying 9 mm spheres centered on the peaks for the preferred category, and selecting the top 80 voxels with highest t-values within the spheres. (B) Comparison between different MVPD models. For each seed predictor region (left: FFA; right: PPA), we plotted the difference matrix of t-values across the five example MVPD models. As a measure of overall predictive accuracy, the average proportion of variance explained varExpl was computed across the whole brain for each model per participant. For each pair of models, we subtracted the varExpl of one model from another one, obtaining the pairwise difference values. Finally, we conducted a one-tailed t-test on the difference values across all 14 participants. The corresponding t-values were entered into the difference matrix, indicating the extent to which one model outperformed another one in terms of the overall predictive accuracy using the seed region as the predictor. Stars above t-values indicate the statistical significance (***p <0.001;**p <0.01;*p <0.05; Bonferroni-corrected).

