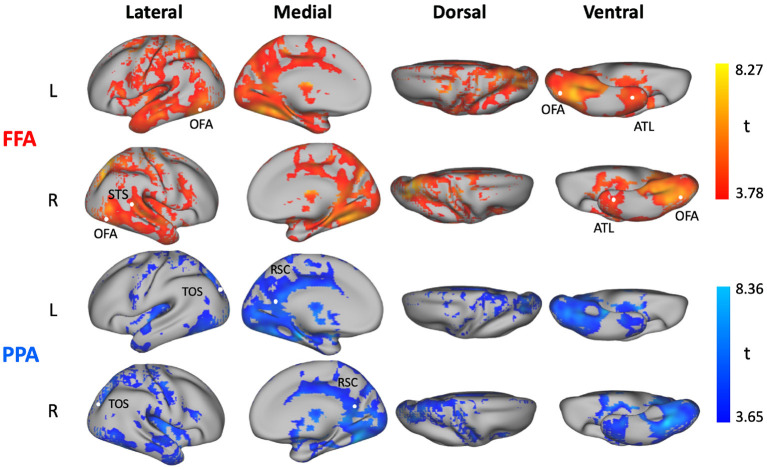
Figure 3.
Comparison between neural network (NN) models and linear regression (LR) models. Statistical t-maps computed across subjects from the voxelwise difference between the average variance explained predicted by three NN models (NN_1layer, NN_5layer, NN_5layer_dense), and the average variance explained predicted by two LR models (L2_LR, PCA_LR) with FFA (top) and PPA (bottom) as predictor ROIs, respectively. The SnPM threshold corrected at p <0.05 FWE is 3.78 using FFA as predictor and is 3.65 using PPA as predictor.

