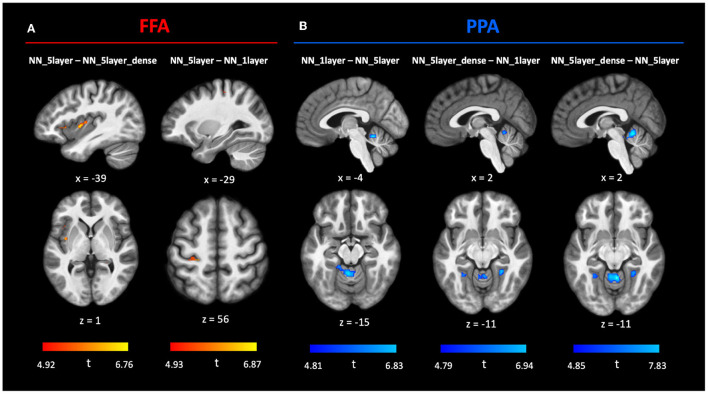
Figure 4.
Comparison between MVPD neural network (NN) models. Statistical t-maps computed across subjects from the pairwise difference between the variance explained predicted by three neural network models (NN_1layer, NN_5layer, NN_5layer_dense) with FFA (A) and PPA (B) as predictor ROIs, respectively. The SnPM p-values were Bonferroni corrected for all 6 comparisons. We showed interesting brain regions that were better predicted by one NN model than the other NN model at p <0.05 FWE after Bonferroni correction. The full NN model comparison results can be found in Supplementary Table 1 (FFA) and Supplementary Table 2 (PPA).

