. 2022 May 25;63(4):455–463. doi: 10.4111/icu.20220085

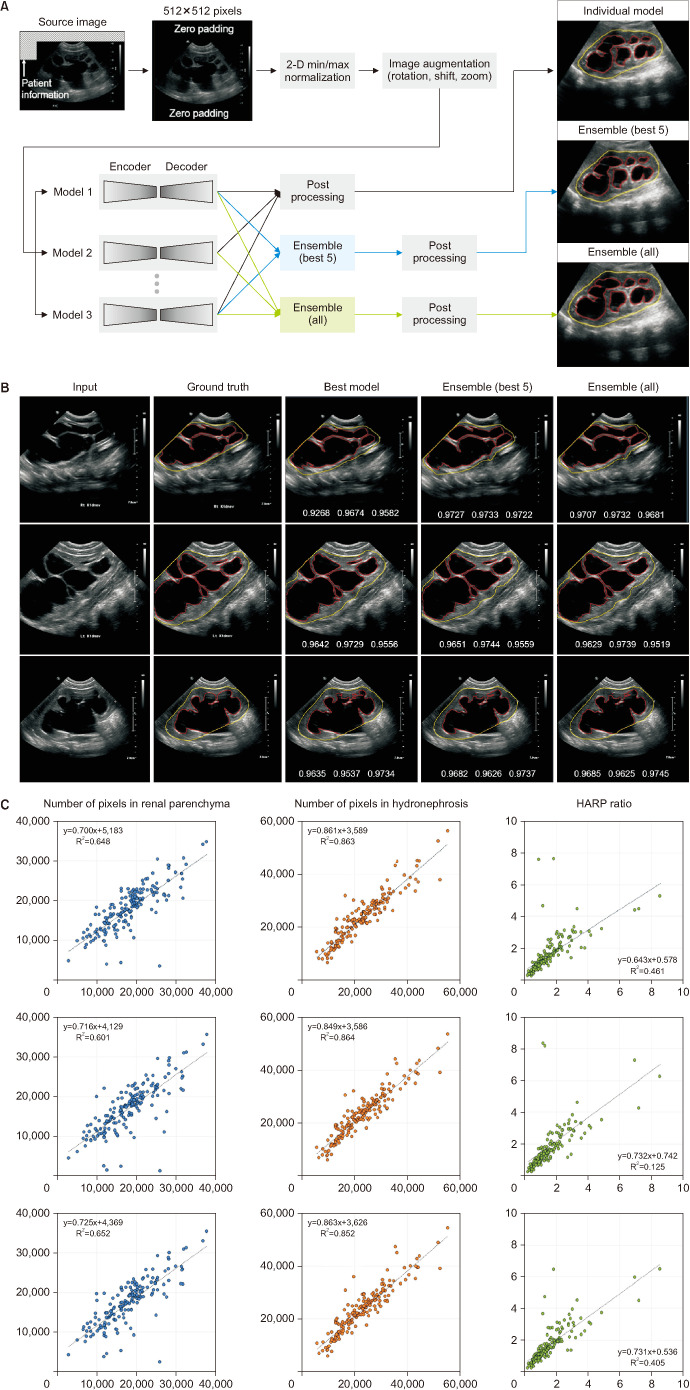
Fig. 1. (A) Schematic diagram for deep-learning segmentation of ultrasonography. (B) Representative examples of hydronephrotic kidney segmentation. The boundaries of the kidney and hydronephrosis area are colored yellow and red, respectively. At the bottom of the images in the third to fifth columns, the dice similarity coefficients are presented in order of average, kidney boundary, and hydronephrosis area. The “best model” in the third column indicates the combination of DeepLabV3+ and EfficientNet-B4. (C) Scatter plots of deep-learning prediction (ensemble model) versus manually traced label: best model (combination of DeepLabV3+ and EfficientNet-B4 in the first row); ensemble of the five best models (second row); ensemble of all models (third row). HARP, hydronephrosis area to renal parenchyma.

Fig. 1