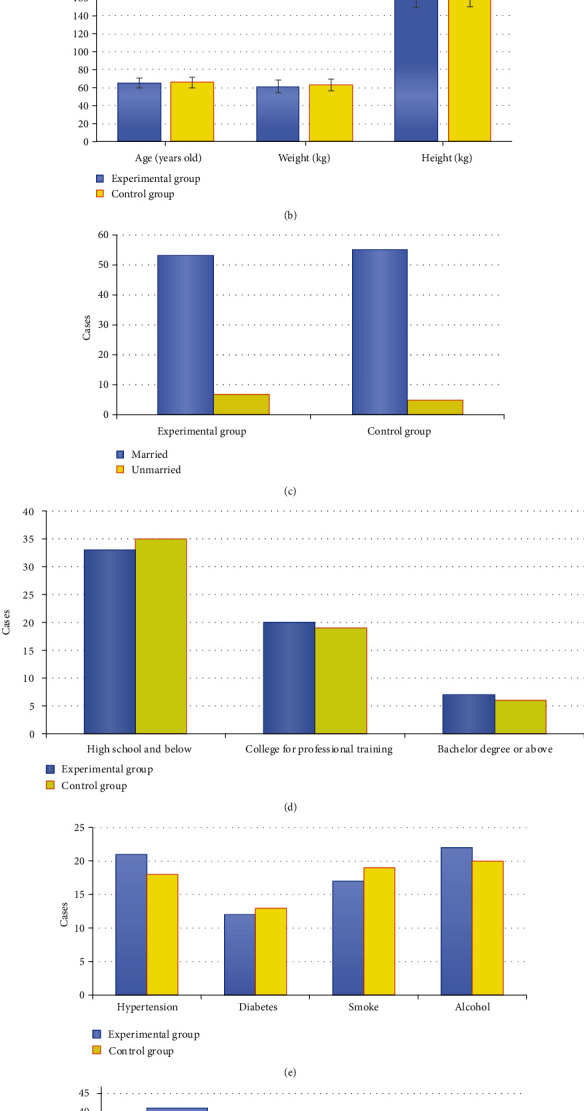
Figure 3.

Comparison of general data between the experimental group and the control group: (a) gender; (b) age, height, and weight; (c) marital status; (d) education level; (e) diabetes, hypertension, smoking, and alcohol consumption; (f) ASA classification.
