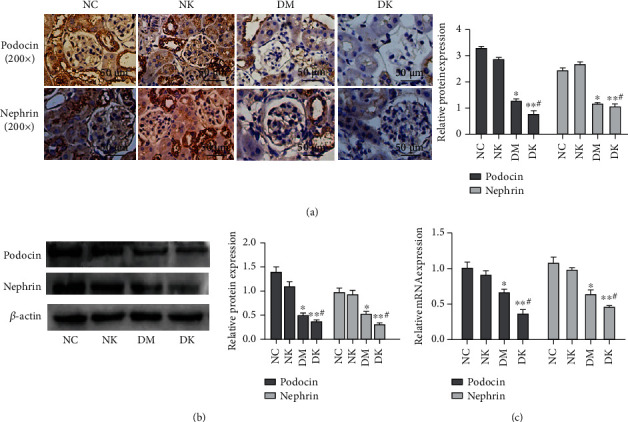
Figure 3.

(a) The expression of podocin and nephrin in renal tissues of each group was detected by immunohistochemistry (SP assay, 200x). (b) WB detected the expression of podocin and nephrin in tissues. (c) RT-qPCR detected the expression of podocin and nephrin in tissues. Compared with the NC group, ∗P < 0.05 and ∗∗P < 0.01. Compared with the DM group, #P < 0.05.
