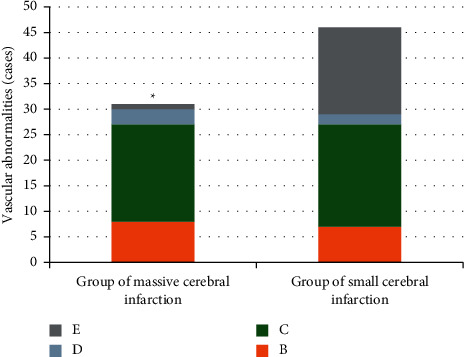
Figure 2.

Comparison of blood vessel conditions of patients between large-area infarction group and small-area infarction group. B, C, D, and E in the figure referred to increased blood flow velocity, decreased blood flow velocity, without blood flow signal, and normal blood vessels, respectively. ∗The difference in the abnormal rate of blood vessels of patients in the two groups was statistically obvious, P < 0.05.
