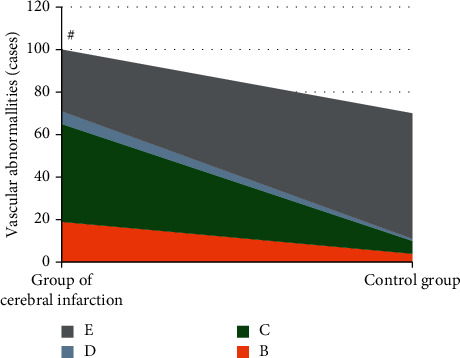
Figure 5.

Comparison on the blood vessel condition of patients in the CI + V group and the control group. B, C, D, and E referred to increased blood flow velocity, decreased blood flow velocity, without blood flow signal, and normal blood vessels, respectively. #The difference in the abnormal rate of blood vessels of patients in the two groups was statistically obvious, P < 0.01.
