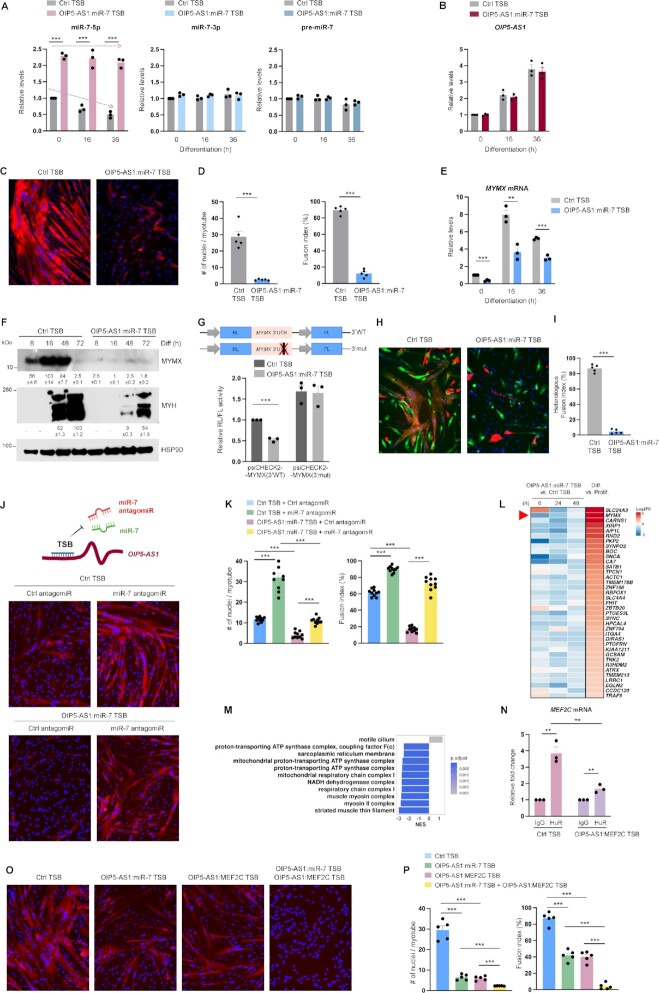
Figure 7.
TSB of OIP5-AS1:miR-7 attenuates myotube formation by inhibiting OIP5-AS1-directed miR-7 degradation. (A) AB678 myoblasts were transfected with TSB (Ctrl TSB or OIP5-AS1:miR-7 TSB); 24 h after transfection, AB678 myoblasts were induced to differentiate, and were collected at the indicated times. The levels of miR-7 (left), miR-7-3p (middle) and pre-miR-7 (right) were measured by RT-qPCR analysis. (B) In cells prepared as described in panel (A), the levels of OIP5-AS1 were measured by RT-qPCR analysis. (C) AB678 myoblasts were transfected with Ctrl TSB or OIP5-AS1:miR-7 TSB; 24 h later, they were placed in differentiation medium for 72 h, and differentiation was monitored by assessing MYH levels by immunofluorescence, and the fusion indices and numbers of nuclei per myotube (D) were quantified after assessing five separate fields per experiment. (E) In cells prepared as described in panel (A), the levels of MYMX mRNA were measured by RT-qPCR analysis. (F) AB678 myoblasts were transfected with Ctrl TSB or OIP5-AS1:miR-7 TSB; 24 h later, they were placed in differentiation medium, and collected at the times shown after the induction of differentiation. The levels of MYMX, MYH and loading control HSP90 were assessed by western blot analysis. Bands were quantified by densitometry and the relative intensities are indicated. (G) Twenty-four hours after co-transfecting the plasmids bearing wild-type or mutant MYMX 3′UTR with Ctrl TSB or OIP5-AS1:miR-7 TSB, AB678 myoblasts were induced to differentiate for 24 h, whereupon RL/FL ratios were determined. As described in Figure 6, EGFP-labeled AB678 cells were transfected with Ctrl TSB (left) or OIP5-AS1:miR-7 TSB (right) and further mixed with mCherry-labeled AB678. The fusion ability was monitored by representative confocal images (H) showing homologous fusion (EGFP+ or mCherry+) and heterologous syncytia (both EGFP+ and mCherry+), and the heterologous fusion index (I) was quantified after assessing five separate fields per experiment. AB678 myoblasts were transfected with Ctrl TSB or OIP5-AS1:miR-7 TSB along with either Ctrl antagomiR or miR-7 antagomiR; they were then placed in differentiation medium for 72 h, and the progression of differentiation was monitored by assessing MYH levels by immunofluorescence (J), and by measuring fusion indices and numbers of nuclei per myotube (K) in five separate fields per experiment. (L) Expression levels of 37 myogenesis-associated mRNAs that are predicted targets of miR-7, are significantly downregulated after introducing OIP5-AS1:miR-7 TSB (by 0, 24 or 48 h of differentiation) and are upregulated during myogenesis for 24 h (see also Supplementary Figure S6). Significance was established using Padj < 0.05, and log2FC > 1 (Prolif: proliferating; Diff: differentiated). (M) GSEA of differentially expressed genes in OIP5-AS1:miR-7 TSB treated cells. GO annotations based on cellular components; top 10 gene sets were established using normalized enrichment score. (N) AB678 myoblasts were transfected with Ctrl TSB or OIP5-AS1:MEF2C TSB; 24 h later, they were placed in differentiation medium for 24 h, and the binding of HuR to MEF2C mRNA was assessed by cross-linking RIP analysis; data were normalized to the levels of GAPDH mRNA in each IP sample and represented as the enrichment of each mRNA in HuR IP samples relative to the levels of the mRNA in IgG IP samples. AB678 myoblasts were transfected with Ctrl TSB, OIP5-AS1:miR-7 TSB, OIP5-AS1:MEF2C TSB (50 nM each) or with a cocktail of OIP5-AS1:miR-7 TSB (25 nM) plus OIP5-AS1:MEF2C TSB (25 nM); 24 h later, they were placed in differentiation medium for 72 h, and differentiation was monitored by assessing MYH levels by immunofluorescence (O), and by measuring the fusion indices and the numbers of nuclei per myotube (P) in five separate fields per experiment. Data in panels (A), (B), (D)–(G), (I), (K), (N) and (P) represent the means ± SEM from at least three independent experiments. Significance was established using Student’s t-test. **P < 0.01; ***P < 0.001. Other data are representative of three or more biological replicates.

