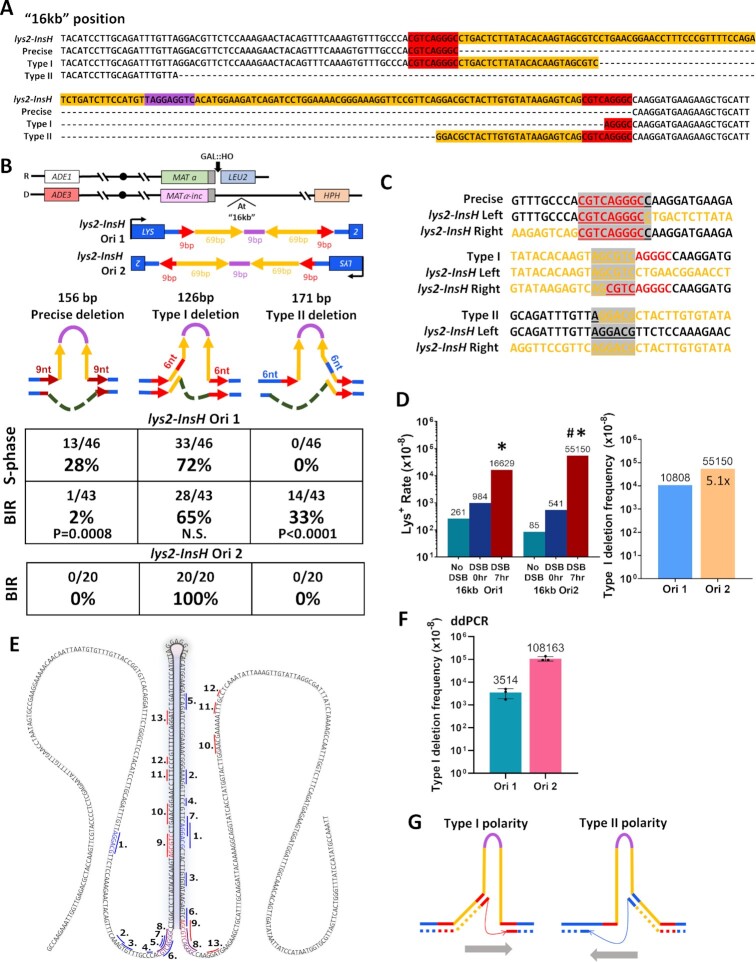
Figure 2.
(A) Sequences of full lys2-InsH reporter and its derivatives following precise (restoring the wild type LYS2 allele) and imprecise (Type I and Type II) deletions of InsH. Colors correspond to those depicted in Figure 1A from the full-length lys2-InsH. (B) Distribution of various types of InsH deletions among Lys+ revertants obtained in strains with the lys2-InsH reporter at 16kb in Orientation 1 (Ori1) or Orientation 2 (Ori2). (Upper) Schematic of lys2-InsH reporter inserted at 16kb in Orientation1 (Ori1) and Orientation 2 (Ori2). (Lower) Schematics of deletion types in Lys+ outcomes with respect to the hairpin structure formed by the InsH insertion in LYS2 at 16kb in Ori1 and Ori2. These deletion types generate an in-frame LYS2 gene (126, 156 and 171 bp deletions are all divisible by 3). “S-phase”: deletions that occurred in No DSB strains. “BIR”: deletions among Lys+ revertants obtained after BIR. P-values are shown to indicate statistically significant differences (P < 0.05) measured by Fisher's exact test for the deletion type fraction during BIR compared to S-phase. N.S. = no significant difference (P ≥ 0.05). (C) Alignment of lys2-InsH deletion breakpoints for precise, Type I, and Type II deletions to left and right sides of the full lys2-InsH sequence. Colors correspond to those depicted in A from the full length lys2-InsH allele in the donor chromosome. Gray highlighted and underlined bases are indicative of breakpoint microhomologies. (D) Left. Lys+ reversion frequencies of the Ori1 and Ori2 reporters. The data for Ori1 reporter are the same as shown in Figure 1B. Asterisks indicate statistically significant difference (P < 0.0001) from Lys+ reversion rates at 0 h (DSB 0 h). Pound symbol indicates statistically significant difference (P < 0.0001) from Lys+ reversion rate in Ori1 at 7 h (DSB 7 h). Right. Frequencies of Type I deletions after BIR in Ori1 and Ori2 reporter strains. Frequencies (shown above bars) were calculated by multiplying the fraction of BIR-associated Type I mutations (in B) by the rates shown in (D). Fold increase of Ori2 Type I over Ori1 Type I is shown inside the bar for Ori2. (E) Summary of InsH deletion types identified by deep sequencing. The numbers correspond to the types in Supplementary Data S3 and S4. The colored lines indicate microhomologies at deletion breakpoints: red – Type I-like, blue – Type II-like. Colored sequence indicates microhomologies at breakpoints: red – Type I deletion, blue – Type II deletion, purple – precise deletion. (F) Frequencies of Type I deletions in the lys2-InsH Ori1 and Ori2 reporters as determined by ddPCR experiments. Averages ± SD based on the results of three experiments are shown. (G) Schematic of InsH deletion polarities for observed deletion types. Gray arrows indicate the implied direction of synthesis. The colors of microhomologies are similar to (E).

