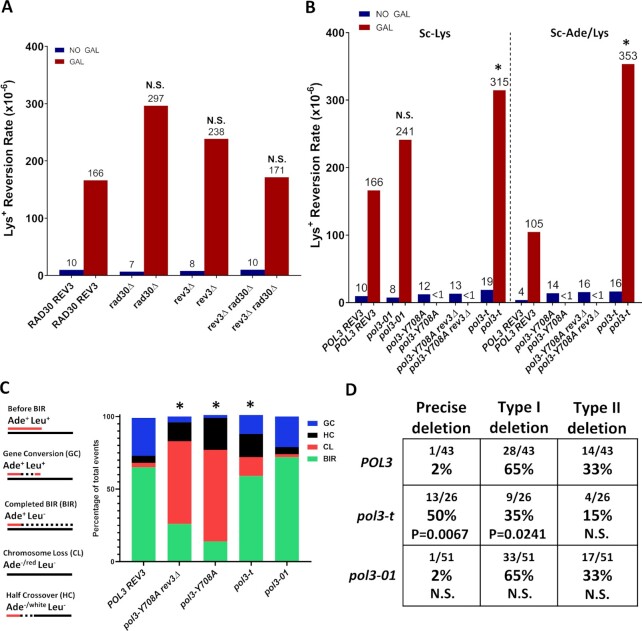
Figure 3.
The effect of polymerase mutations on InsH deletions. (A) Eliminating Pol η (rad30Δ) or Pol ζ (rev3Δ) does not affect the frequency of Lys+ resulting from deletions in lys2-InsH at 16kb during BIR. “NO GAL” = rates prior to the addition of galactose. “GAL” = Lys+ rates following BIR. Median values are listed above the bars. N.S. = not significantly different from wild-type (RAD30 REV3) (P≥0.05 determined by Mann-Whitney U test, see Supplementary Data S5 for P-values and 95% CI). (B) The effects of mutations in POL3, including: pol3-01, pol3-Y708A, and pol3-t on Lys+ reversion rate after BIR induction in strains harboring the lys2-InsH reporter at the 16kb position. Sc-Lys: Lys+ were selected for lysine prototrophy only. Sc-Ade/Lys: Lys+ were selected for lysine and adenine prototrophy to eliminate chromosome loss and half-crossover outcomes which exhibit adenine auxotrophy. Asterisks indicate values that were significantly different (P < 0.01) from wild-type (POL3) and N.S. indicates no significant difference (P ≥ 0.05) from wild-type (POL3). “<1” indicates that rates were not calculable (see Supplementary Data S5 for frequencies used in rate calculation). Other details similar to (A). (C) BIR efficiency is reduced (and chromosome loss and half-crossovers increased) in pol3-Y708A and pol3-t mutants as compared to POL3. BIR efficiency is not affected in pol3-01. Asterisks indicate significant differences in DSB repair outcome fractions from POL3 (P < 0.05) measured by Fisher's exact test. Different DSB repair outcomes are illustrated in the schematic (left). (D) lys2-InsH deletion spectra in POL3, pol3-t, and pol3-01 strains. P-values are listed to indicate statistically significant differences (P < 0.05) in the fractions of individual deletion types compared to POL3 measured by Fisher's exact test. N.S. = no significant difference (P ≥ 0.05).

