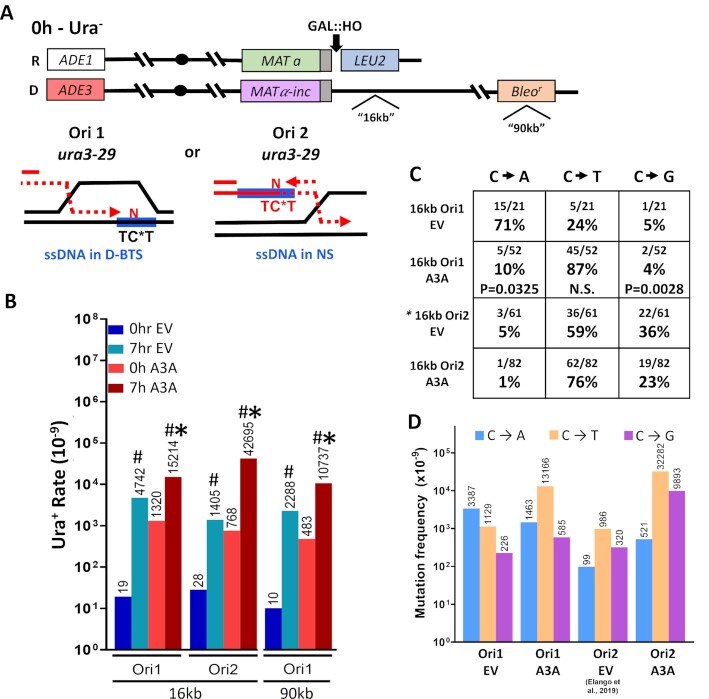
Figure 4.
ssDNA in the D-BTS is susceptible to mutagenesis induced by APOBEC3A. (A) Top. Yeast disomic BIR system similar to that shown in Figure 1A, but with the ura3-29 (base substitution) reporter inserted at the 16kb and 90kb positions in two orientations (Ori1 and Ori2). Note: strains with ura3-29 at 16kb contained KanMX at 90 kb position instead of Bleor. Prior to BIR (0h), the strain is Ura−. Bottom. schematic showing location of TCT motif recognized by A3A in the template for the BIR leading strand ssDNA of the Ori1 ura3-29 reporter (ssDNA in D-BTS), and in the ssDNA in the template for the lagging strand of the Ori2 ura3-29 reporter (ssDNA in nascent strand (NS)). Blue rectangles indicate ssDNA. Cytidine deamination (indicated with an asterisk) in either of these locations can produce reversion to a Ura+ phenotype if any base other than G is incorporated. (B) Rates (solid bars) of Ura+ reversions before (0 h) and after BIR (7 h), in the presence of a plasmid containing APOBEC3A (A3A) or empty vector (EV) in UNG1 strains with ura3-29 reporter in Ori1 and Ori2 at 16 kb and Ori1 at 90 kb. Median values are listed above each bar. Significant differences (P < 0.005) for the comparisons of A3A and EV strains following BIR (7 h) are marked with asterisks. Pound symbols indicate significant differences (P < 0.01) for the comparison of A3A- or EV-containing strains to their respective pre-BIR (0 h) levels. See Supplementary Data S6 for P-values, 95% CIs and details on rate calculation. (C) Ura+ mutation spectra in Ori1 and Ori2 reporter strains expressing A3A or EV during BIR in the UNG1 (wild type) background. Asterisk indicates data from (21). P-values are listed to indicate statistically significant differences (P < 0.05) of Ori1 A3A from Ori2 A3A spectra. N.S. = no significant difference. (D) Frequencies of individual substitution mutations after BIR in the UNG1 (wild type) strain with Ori1 or Ori2 reporters. Ori2 EV spectra data used are from (21). Frequencies were calculated by multiplying the fraction of each mutation type (in C) by the rates shown in B, and statistics are shown in (B) and (C).

