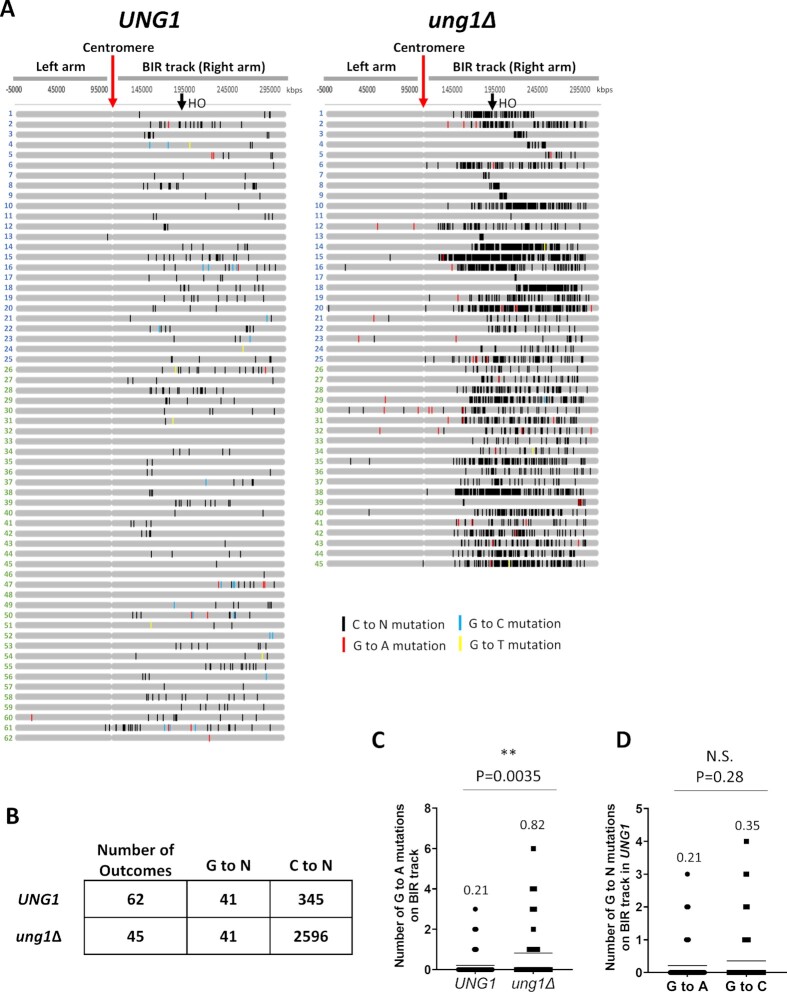
Figure 5.
(A) A3A-induced mutations at cytosines (C to N: black tick-marks) and guanines (G to A: red, G to C: blue, and G to T: yellow tick-marks) on Chromosome III (Watson or 5’ to 3’ strand) identified by WGS of BIR outcomes from UNG1 and ung1Δ backgrounds exposed to A3A. Outcomes numbered in blue or green are from independent experiments (see Supplementary Data S7 for details). (B) Summary of total number of G to N and C to N mutations on the right arm (BIR track) in BIR outcomes from UNG1 and ung1Δ backgrounds shown in (A). (C) Number of G to A mutations per outcome on the track of BIR (right arm) in UNG1 and ung1Δ backgrounds. Horizontal lines indicate mean values that are also listed above each plot. P-value obtained by unpaired t-test is listed above the plot to indicate statistical significance (asterisk) or no statistical significance (N.S.) of difference in the mutation number. (D) Number of G to N mutations per outcome (G to A or G to C) on the track of BIR (right arm) in the UNG1 background. Mean values and statistical significance are as in (C).

