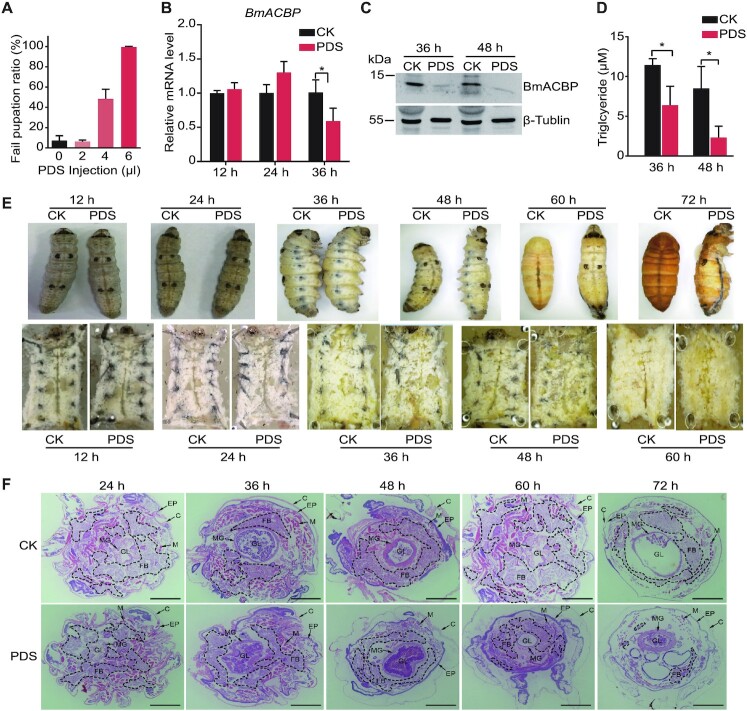
Figure 4.
Effect of PDS on the development of prepupal B. mori. (A) Ratio of larvae that unsuccessfully pupated after PDS injection. (B) mRNA expression of BmACBP after PDS injection in B. mori. (C) Western blot analysis of BmACBP protein levels after PDS injection in B. mori. (D) Values for fat body TAG accumulation. (E) Morphological and anatomical comparison between the experimental group and the control group. The white tissues in the anatomical images (bottom panel) are fat bodies. (F) Haematoxylin and eosin (HE) staining of cross-sections of B. mori. PDS was injected into the lateral side of thorax between the second and third segments of the last fifth-instar larvae at the early spinning stage, and the cross-sections were obtained at corresponding time points. Fat bodies are surrounded by black dotted lines. FB: fat body; C: cuticle; EP: epidermis; M: muscle; MG: midgut; GL: gut lumen. The data are the mean ± SEM (n = 3). *P < 0.05 (Student's t test). All scale bars, 1 mm.

