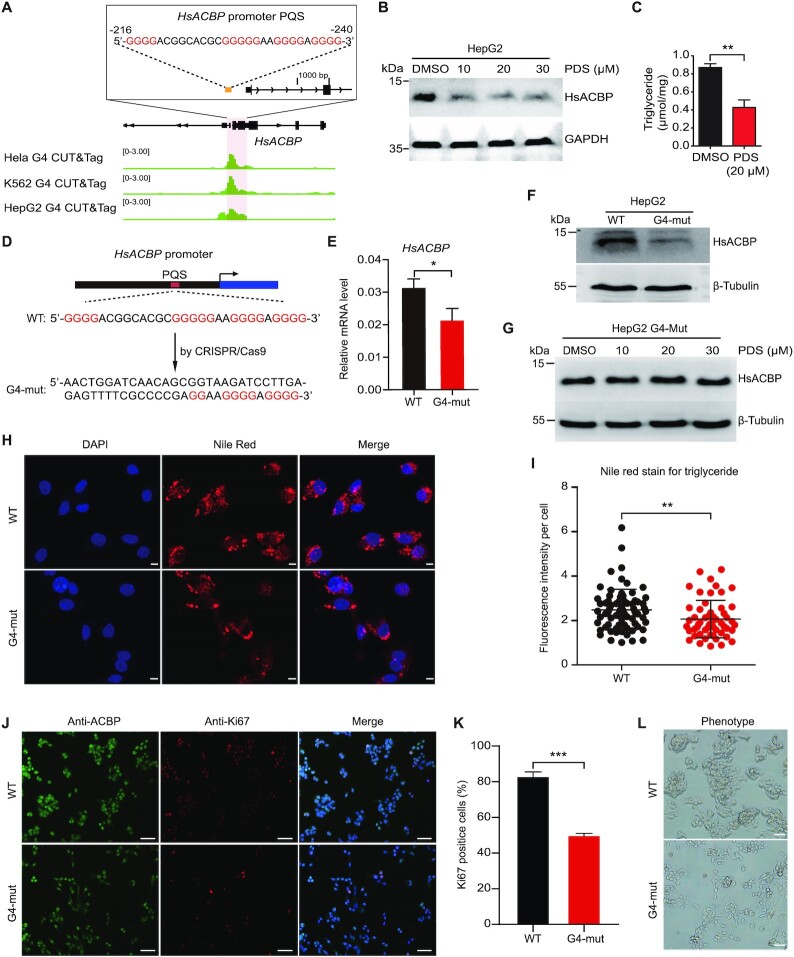
Figure 5.
Regulation of the expression of HsACBP by targeting of G4 in human HepG2 cells. (A) G4 CUT&Tag signals at the HsACBP promoter loci. G4 CUT&Tag data for HeLa and K562 cells were obtained from the NCBI Gene Expression Omnibus database (GSE178668) (41). G4 CUT&Tag data for HepG2 cells were generated in this study. (B) Western blot analysis of HsACBP after PDS treatment. (C) Detection of TAG content after treatment of HepG2 cells with 20 μM PDS. (D) The HsACBP promoter PQS was mutated by CRISPR–Cas9. (E, F) mRNA and protein levels of HsACBP in G4-wild-type and G4-mutant cells. (G) Western blot analysis of HsACBP after PDS treatment in G4-mut HepG2 cells. (H, I) Representative images and quantification of Nile red staining for TAG in G4-wild-type and G4-mutant cells. All scale bars, 5 μm. (J) Representative immunofluorescence staining of G4-wild-type and G4-mutant cells for ACBP and the proliferation marker Ki67. All scale bars, 50 μm. (K) Quantification of the Ki67 index. The data in C, E and J are the mean ± SEM (n = 3); the data in H are the mean ± SD (n > 50). *P < 0.05, **P < 0.01, ***P < 0.001 (Student's t test). (L) Phenotypes of G4-wild-type and G4-mutant cells. The proliferation of G4-mutant cells was significantly inhibited. All scale bars, 50 μm.

