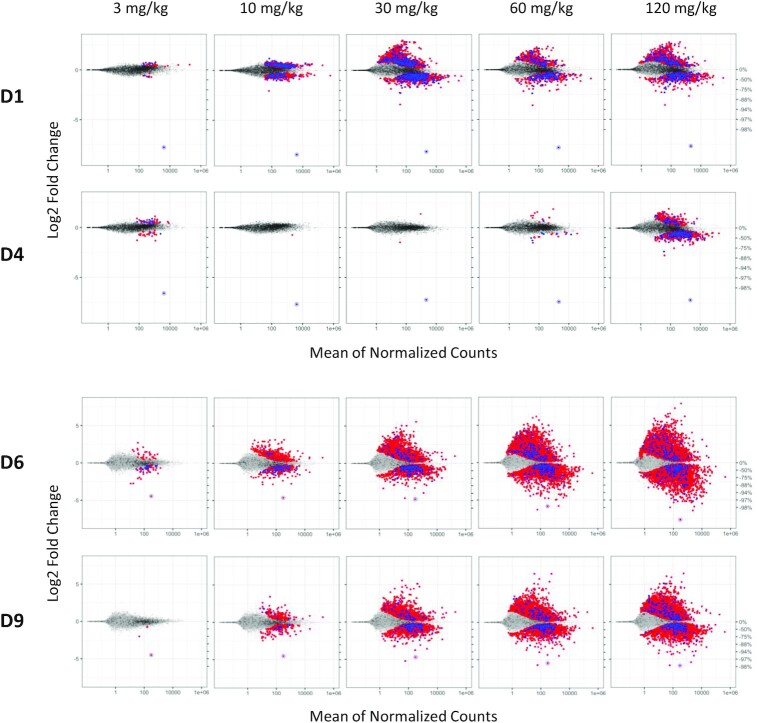
Figure 3.
Transcriptional dysregulation in rat livers following three weekly doses of GalNAc–siRNAs targeting Ttr (D1, D4, top) or Hao1 (D6, D9, bottom). Frozen livers were collected 24 h after last dose for RNA-seq analysis. Log2 fold change plots (MA plot) represent the average signal from each cohort (n = 4–5). Dots represent individual rat gene transcripts, their average read count and the level of change in expression compared to the control group dosed with 0.9% NaCl. Whereas gray dots represent gene transcripts that were not determined to be differentially expressed after siRNA treatment relative to the control, the blue and red dots represent differentially expressed gene transcripts (false discovery rate < 0.05) with or without a canonical miRNA match (8mer, 7mer-m8, 7mer-A1 and mer6) to the guide seed region, respectively. On-target knockdown is represented by the circled dot.

