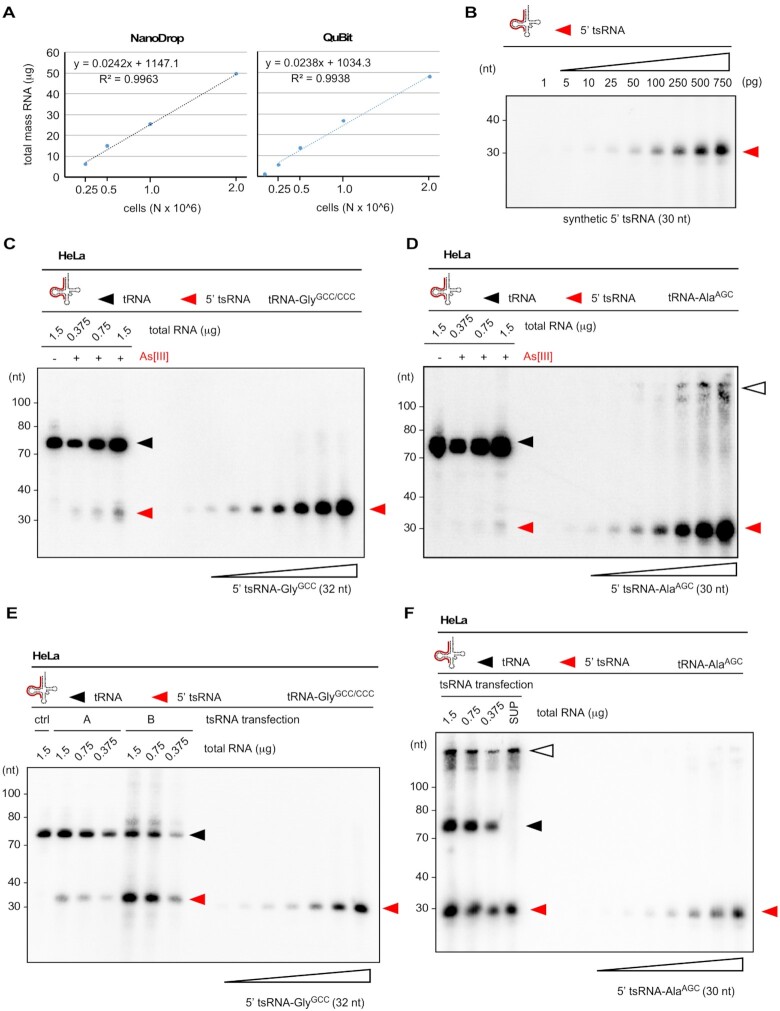
Figure 2.
(A) The combined mass of total RNA extracted from defined HeLa cell numbers was measured using NanoDrop™ (left) or QuBit™ (right) and plotted against cell numbers. A function was derived allowing to calculate the mass of total RNA per HeLa cell. (B) Northern blotting on increasing mass (1–750 pg) of a synthetic tRNA fragment (5′ tsRNA-AlaAGC) using a probe against the 5′ end of tRNA-AlaAGC. Signals obtained by phospho-imaging were used to measure pixel densities (ImageJ), which were plotted against tsRNA mass. This allowed to create a standard curve for tsRNA signals. Red arrowheads: 5′ tsRNAs. (C) Northern blotting of total RNA from control HeLa cells (1.5 μg) and HeLa cells (0.375–1.5 μg) exposed to As[III] (0.5 mM, for 1 h) in combination with increasing mass (5–750 pg) of a synthetic tRNA fragment (5′ tsRNA-GlyGCC) using a probe against the 5′ end of tsRNA-GlyGCC. Signals obtained by phospho-imaging were used to measure pixel densities at the level of tsRNAs (ImageJ), which were used to create a standard curve with a linear function to calculate the mass and copy numbers of 5′ tsRNA-GlyGCC per HeLa cell. Black arrowhead: mature tRNAs; red arrowheads: 5′ tsRNAs. (D) Northern blotting of total RNA as described in (C) in combination with increasing mass (5–750 pg) of a synthetic tRNA fragment (5′ tsRNA-AlaAGC) using a probe against the 5′ end of tsRNA-AlaAGC. Signals obtained by phospho-imaging were used to derive mass and copy numbers of 5′ tsRNA-AlaAGC per HeLa cell. Black arrowhead: mature tRNAs; red arrowheads: 5′ tsRNAs; white arrowhead: higher-order structures of 5′ tsRNA-AlaAGC in wells and with low mobility. (E) Northern blotting of total RNA extracted from control HeLa cells (1.5 μg) and HeLa cells (1.5-0.375 μg) transfected with two molarities of a synthetic 5′ tsRNA-GlyGCC (A: 10 nM, B: 100 nM) in combination with increasing mass (5–750 pg) of a synthetic tRNA fragment (5′ tsRNA-GlyGCC) using a probe against the 5′ end of tRNA-GlyGCC. Signals obtained by phospho-imaging were used to measure pixel densities at the level of tsRNAs (ImageJ), which were used to create a standard curve with a linear function to calculate the mass and copy numbers of transfected 5′ tsRNA-GlyGCC per HeLa cell. Black arrowhead: mature tRNAs; red arrowheads: 5′ tsRNAs. (F) Northern blotting of total RNA extracted from HeLa cells (1.5–0.375 μg) transfected with a synthetic 5′ tsRNA-AlaAGC (10 nM), and a fraction of the medium (1/15th) that was removed at the time of analysis, in combination with increasing mass (5–750 pg) of a synthetic tRNA fragment (5′ tsRNA-AlaAGC) using a probe against the 5′ end of 5′ tRNA-AlaAGC. Signals obtained by phospho-imaging were used to measure pixel densities at the level of tsRNAs (ImageJ), which were used to create a standard curve with a linear function to calculate the mass and copy numbers of transfected 5′ tsRNA-AlaAGC per HeLa cell. Black arrowhead: mature tRNAs; red arrowheads: 5′ tsRNAs; white arrowhead: higher-order structures of 5′ tsRNA-AlaAGC in wells and with low mobility.

