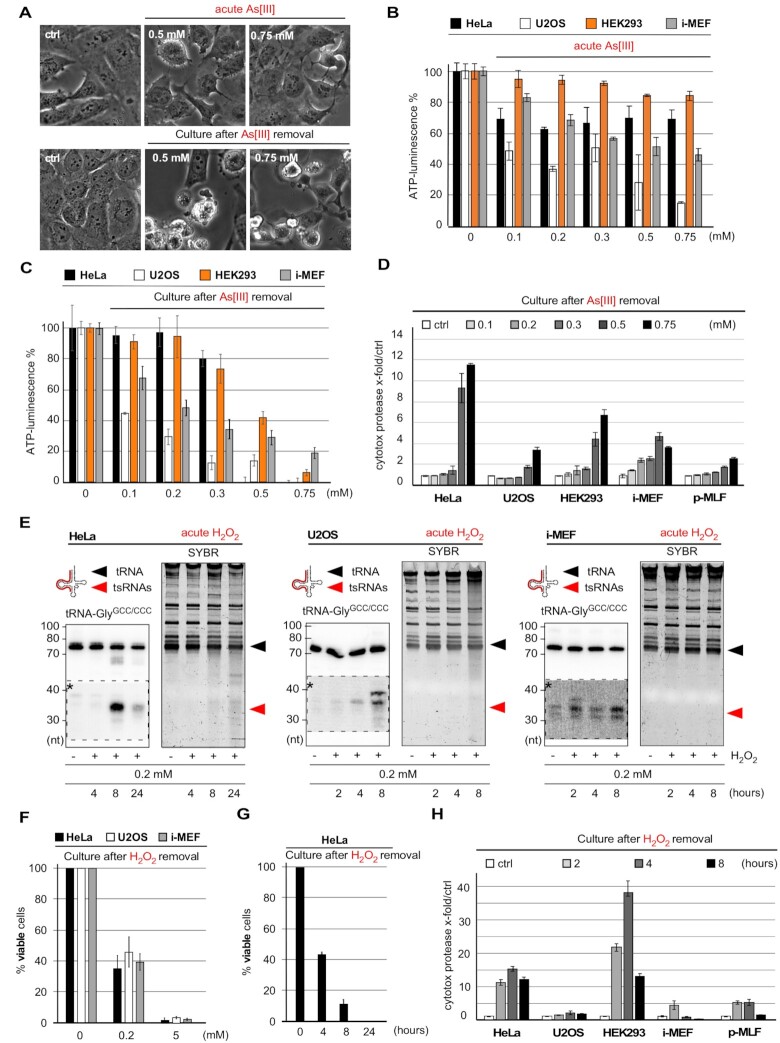
Figure 4.
(A) Phase-contrast images of U2OS cells after exposure to > 0.5 mM As[III] (for 2 h) and 24 h after removal of the stressor. (B) Bar-chart depicting ATP measurements in HeLa, U2OS, HEK293 cells and i-MEF immediately after time-limited exposure (1 h) to increasing As[III] molarities (acute As[III]). Error bars depict standard deviation (SD) of triplicate measurements from three independent wells in the same experiment. (C) Bar-chart depicting ATP measurements in HeLa, U2OS, HEK293 cells and i-MEF after time-limited exposure (one hour) to As[III] (as in B) followed by culturing cells for 24 h after As[III] removal. Error bars depict standard deviation (SD) of triplicate measurements from three independent wells in the same experiment. (D) Bar-chart depicting the quantification of luminescence created by cytotoxic protease activity in the culture medium of HeLa, U2OS, HEK293 cells, i-MEF and p-MLF after time-limited exposure (1 h) to As[III] (as in B), followed by culturing cells for 24 h after the removal of As[III]. Error bars depict standard deviation (SD) of triplicate measurements from three independent wells in the same experiment. (E) Northern blotting of total RNA (1.5 μg) from HeLa, U2OS cells and i-MEF exposed to 0.2 mM H2O2 for the indicated times (2, 4, 8, 24 h) using a probe against the 5′ end of tRNA-GlyGCC/CCC. Individual right images: SYBR-staining of PAA gels before transfer onto membranes. Black arrowhead: mature tRNAs; red arrowhead: tsRNAs; dashed insets with asterisks: digitally enhanced against parental tRNA signals. (F) Bar-chart depicting cell membrane-integrity measurements by Tblue staining of HeLa, U2OS cells and i-MEF after exposure to 0.2, or 5 mM H2O2 for 4 h, followed by culturing cells for 24 h after the removal of H2O2. Error bars depict standard deviation (SD) of triplicate cell counts from three independent wells in the same experiment. (G) Bar-chart depicting cell membrane-integrity measurements by Tblue staining of HeLa cells after exposure to 0.2 mM H2O2 as published in (36) and for the indicated times (4, 8, 24 h), followed by culturing cells for 24 h after the removal of H2O2. Error bars depict standard deviation (SD) of triplicate cell counts from three independent wells in the same experiment. (H) Bar-chart depicting the quantification of luminescence created by cytotoxic protease activity in the culture medium of HeLa, U2OS, HEK293 cells, i-MEF and p-MLF after exposure (2, 4, 8 h) to H2O2 (0.2 mM), followed by culturing cells for 24 h after the removal of H2O2. Error bars depict standard deviation (SD) of triplicate measurements from three independent wells in the same experiment.

