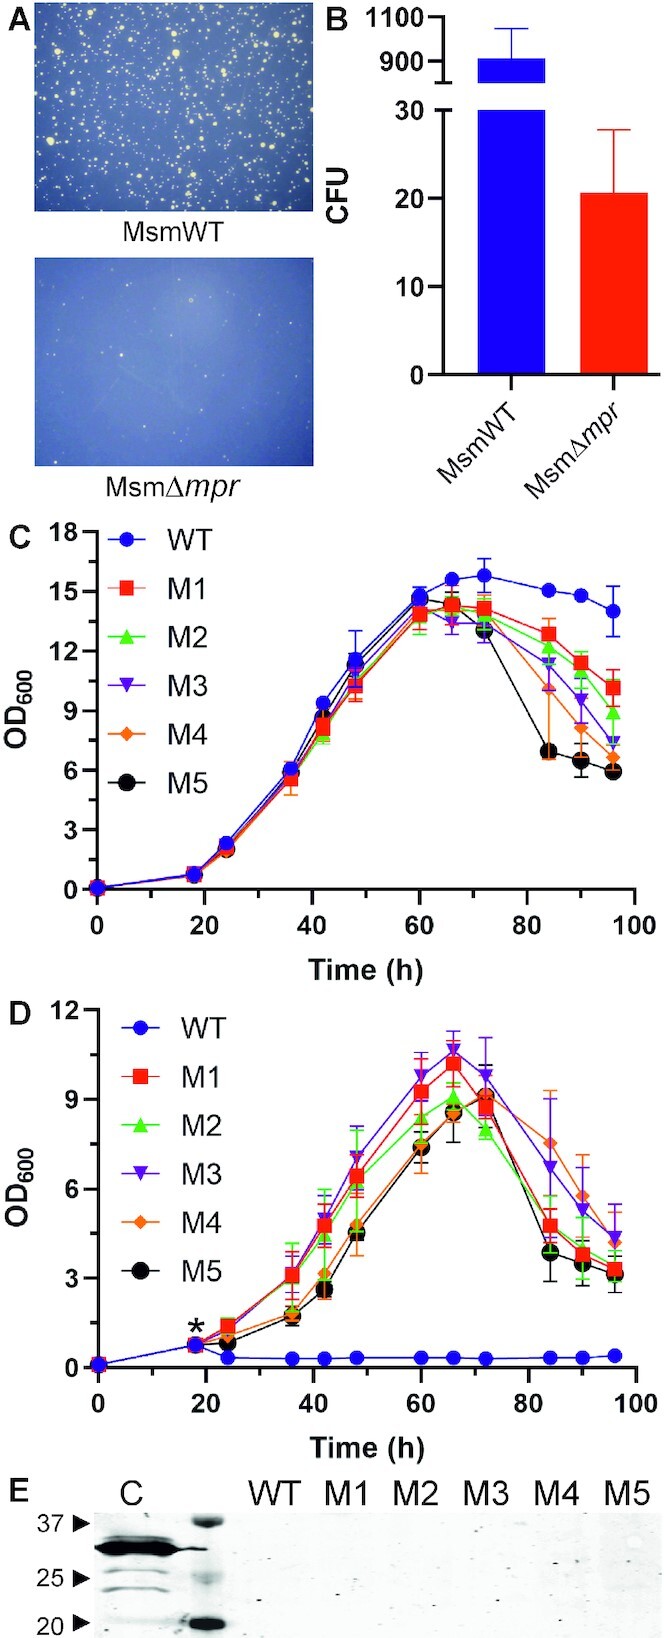
Figure 10.

Phage resistant strains. (A) Emergence of phage resistant colonies in D29 infected MsmWT and MsmΔmpr culture after prolonged incubation on agar plate is shown. (B) Graphical representation of number of resistant colonies in MsmWT as compared to MsmΔmpr is shown. Single mutant colony was isolated by using serial dilution and secondary culture was grown in MB 7H9 media supplemented with OADC till 0.8 OD600 (normalized). Growth curve was performed and OD600 was observed at interval of 6 h under uninfected (C) and infected (D) conditions. ‘*’ in panel D represents phage addition into the culture. (E) Western blot analysis for the expression of Mpr in the infected mutant cultures is shown. Cell lysate (C) of the Mpr overexpressing E. coli cells from an expression vector is used as a control. WT represents the uninfected wildtype M. smegmatis, whereas M1 to M5 are the five different mutants. The lane between the control and the WT is the protein ladder; a few molecular weight bands are marked (in kDa). Anti-Mpr antibody is used to detect Mpr expression.
