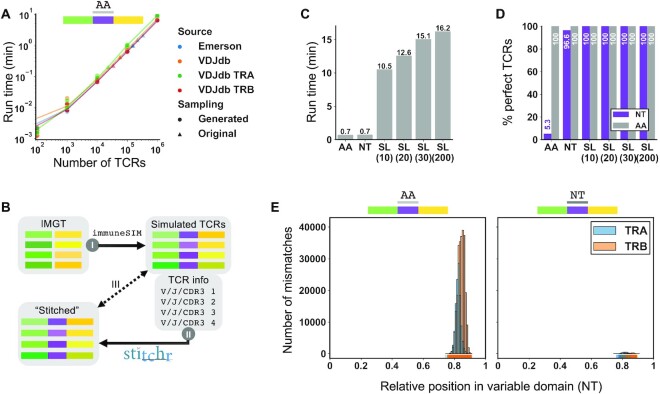
Figure 3.
Application of Stitchr to high-throughput TCR datasets using the companion script Thimble. (A) To benchmark the speed of Thimble, large TCR datasets with amino acid CDR3s provided were downloaded either from bulk beta chain TCR-seq datasets (14), or from the curated antigen-associated TCR database VDJdb (15) (processed both all together and by each chain individually). Thimble, the high-throughput interface to Stitchr, was run on these original files (triangle markers), and from files containing 100–1,000,000 TCRs generated by randomly re-sampling these files (dot markers), with each repertoire size randomly produced 3 times. Connecting lines indicate bootstrapped locally weighted linear regressions. (B) Overview of sequence-level Stitchr validation. TCRs with known V/J/CDR3 information and nucleotide sequence were produced by in silico recombination of IMGT-stored germline genes using immuneSIM (I). V/J genes and CDR3 information (taken as exact junctions in nucleotide or amino acid forms, or as nucleotides with additional padding sequences for seamless mode) were input to Stitchr (via Thimble) (II). TCR variable domain sequences produced by Stitchr were then compared against the corresponding parental simulated TCR sequences (III). (C) Run time duration of Thimble applied to 50,000 α and β TCRs generated by immuneSIM, comparing different formats of junction region input: amino acid (AA), nucleotide (NT), nucleotide with padding nucleotides 5′ and 3′ for seamless (SL) integration, either 10, 20, 30, or 200 nt (200 5′, 30 3′). (D) Percentage of TCRs produced by Stitchr for which the variable region (start of V gene to end of J gene) perfectly matched the input sequence generated by immuneSIM, at both the nucleotide (NT, purple) and translated (AA, grey) levels. (E) Histogram of positional mismatches between simulated and stitched sequences for NT and AA junction input modes. Histograms were generated with 111 bins, so each bar corresponds approximately to one codon (given the variable domain length distribution of ∼333 nucleotides, Supplementary Figure S7A).

