Figure 4.
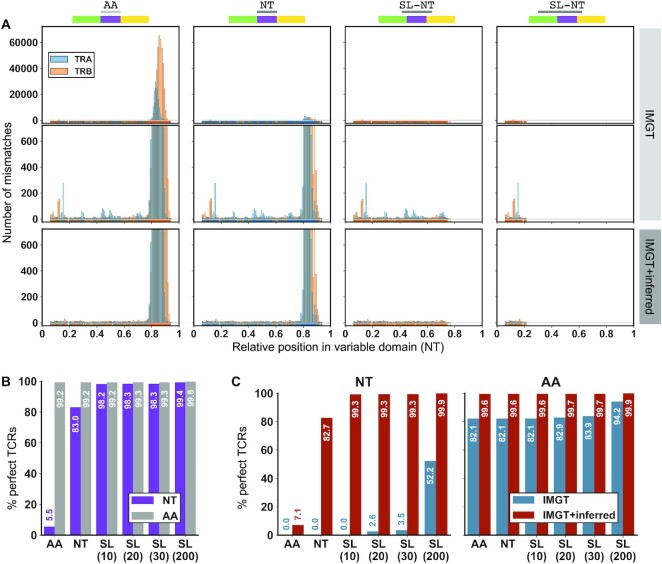
Assessment of Stitchr/Thimble accuracy on high-throughput TCR-seq data. (A) Relative positional mismatches between Thimble-generated sequences and original input sequenced TCRs for different junction inputs: (columns left-to-right): AA, NT, SL (20), SL (200). Top row shows errors when using IMGT-provided TCR germline genes only. Middle row shows the same analysis with expanded Y-axis to highlight the bottom hundredth of the mismatch range. Bottom row shows mismatches upon rerunning Stitchr/Thimble when providing additional novel TCR alleles inferred from the individual donor repertoires. (B) Percentage of all TCRs produced by Stitchr/Thimble that match perfectly to the original input sequences, using the IMGT reference. (C) Percentage of only those TCRs that use a potentially novel inferred V gene allele and agree perfectly between TCR-seq and Stitchr/Thimble output, before (blue) and after (red) including those alleles in the reference dataset, at the nucleotide (left) or amino acid (right) level.

