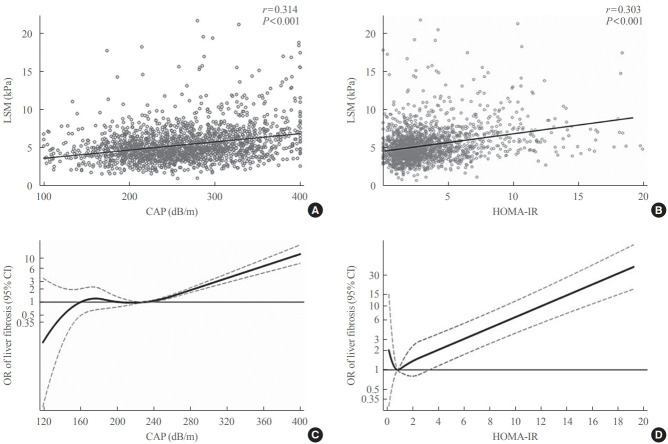
Fig. 2.
Relationship of controlled attenuation parameter (CAP) score and homeostatic model assessment of insulin resistance (HOMA-IR) with liver stiffness measurement (LSM) and liver fibrosis. Simple correlation of LSM with (A) CAP score and (B) HOMA-IR. (C) Restricted cubic spline model of association between CAP score and odds ratio (OR) of clinically significant liver fibrosis (LSM ≥7.5 kPa). (D) Restricted cubic spline model of HOMA-IR with OR of clinically significant liver fibrosis (LSM ≥7.5 kPa). CI, confidence interval.

