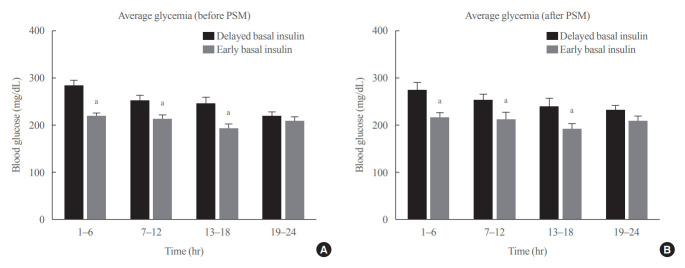
Fig. 3.
Average glucose level categorized into four 6-hour intervals (A) before and (B) after propensity score matching (PSM). Data presented as mean±standard error of the mean. The average blood glucose levels were lower in the first 18 hours. aStatistically significant (P<0.05)by Mann-Whitney U tests.

