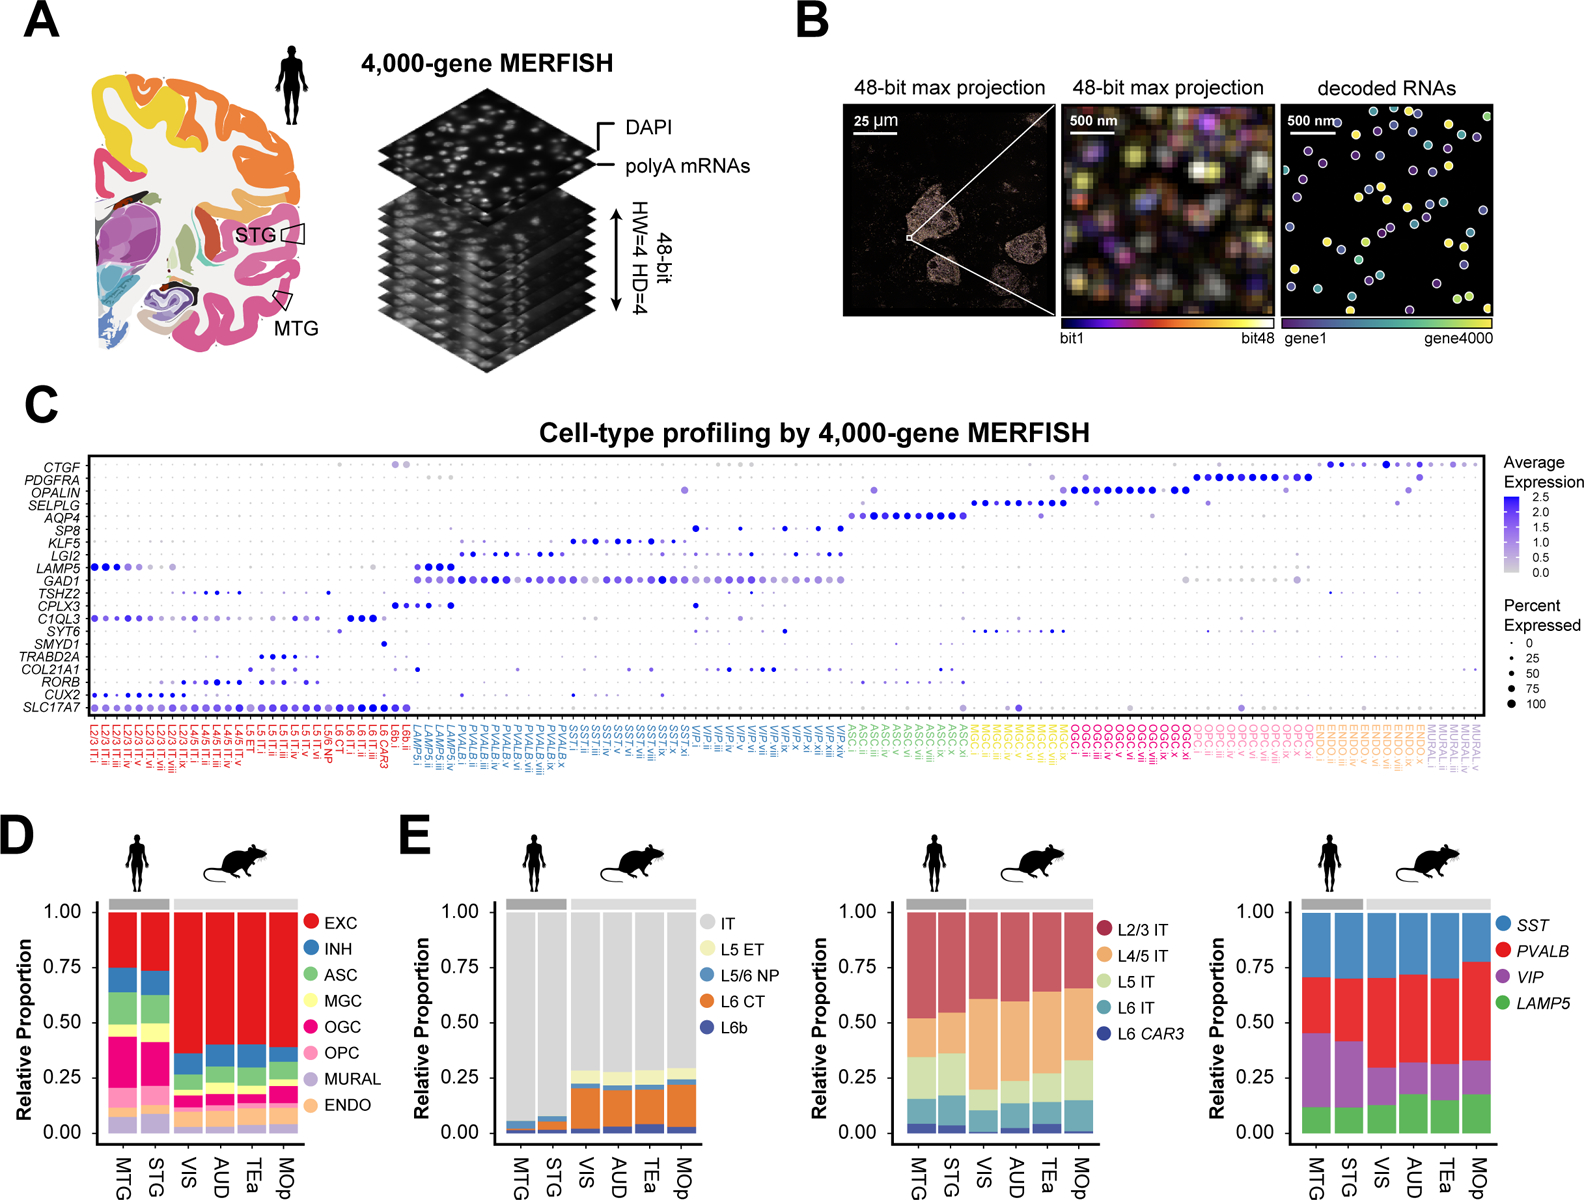
Fig. 1. Spatially resolved single-cell transcriptome profiling of the human cortex by MERFISH.

(A) Schematic of 4000-gene MERFISH measurements of the human MTG and STG using a 48-bit error-correcting code. (B) Example MERFISH images. Left: MERFISH image of a single field-of-view, with maximum projection across all 48 bits shown. Middle: Zoomed-in image of the boxed region. Right: Decoded RNA molecules of the zoomed-in region. Scale bars indicate the real size of the sample prior to expansion. (C) Cell-type classification of the MTG and STG from MERFISH data and the expression of a subset of marker genes. EXC: excitatory neurons; INH: inhibitory neurons; ASC: astrocytes; MGC: microglial cells; OGC: oligodendrocytes; OPC: oligodendrocyte progenitor cells; ENDO: endothelial cells; MURAL: mural cells; IT: intratelencephalic-projecting neurons; ET: extratelencephalic-projecting neurons; NP: near-projecting neurons; CT: cortico-thalamic projecting neurons. The size and color of each dot correspond to the percentage of cells expressing the gene in each cluster and the average normalized expression level, respectively. (D) Proportions of excitatory neurons, inhibitory neurons, and major subclasses of non-neuronal cells in human MTG and STG and four mouse cortical regions including MOp, VIS, AUD and TEa. (E) Proportion of subclasses of excitatory neurons (left), IT neurons (middle), and inhibitory neurons (right) in human MTG and STG and the four mouse cortical regions.
