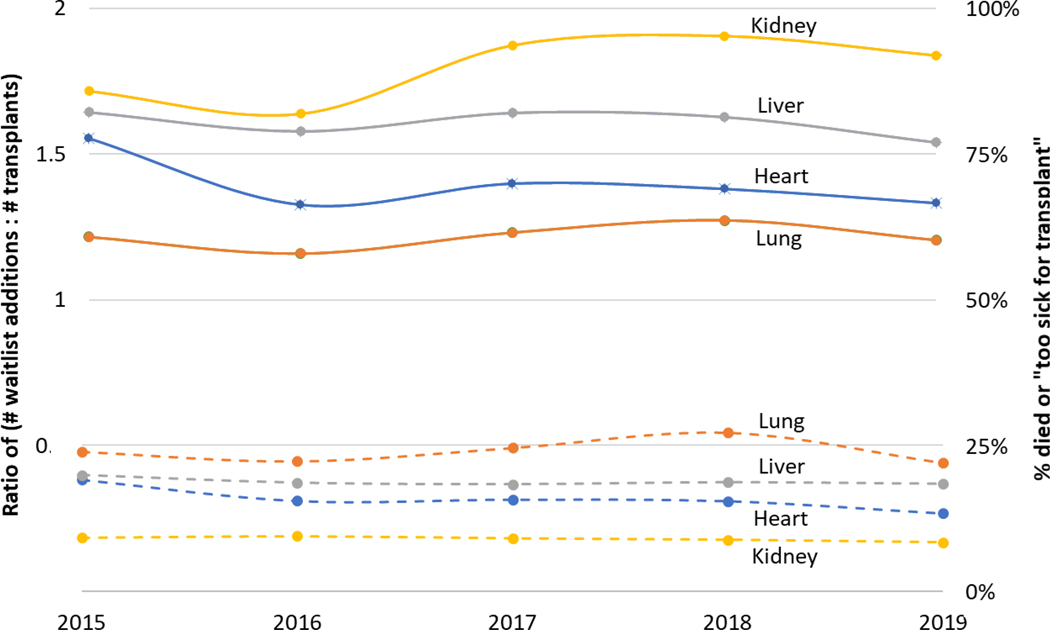
Figure 1:
Supply-demand mismatch created by the shortage of suitable donor organs for solid organ transplantation. Solid lines represent the ratio of waitlist additions to the number of transplants performed per year. Dashed lines represent the percent of candidates who died or were too sick to be transplanted. Data shown for kidney, liver, heart, and lung transplants from 2015–2019.
Source:
2019 Annual Data Report. Scientific Registry of Transplant Recipients http://srtr.transplant.hrsa.gov/annual_reports/Default.aspx Accessed February 9, 2022
2017 Annual Data Report. Scientific Registry of Transplant Recipients http://srtr.transplant.hrsa.gov/annual_reports/Default.aspx Accessed February 9, 2022

