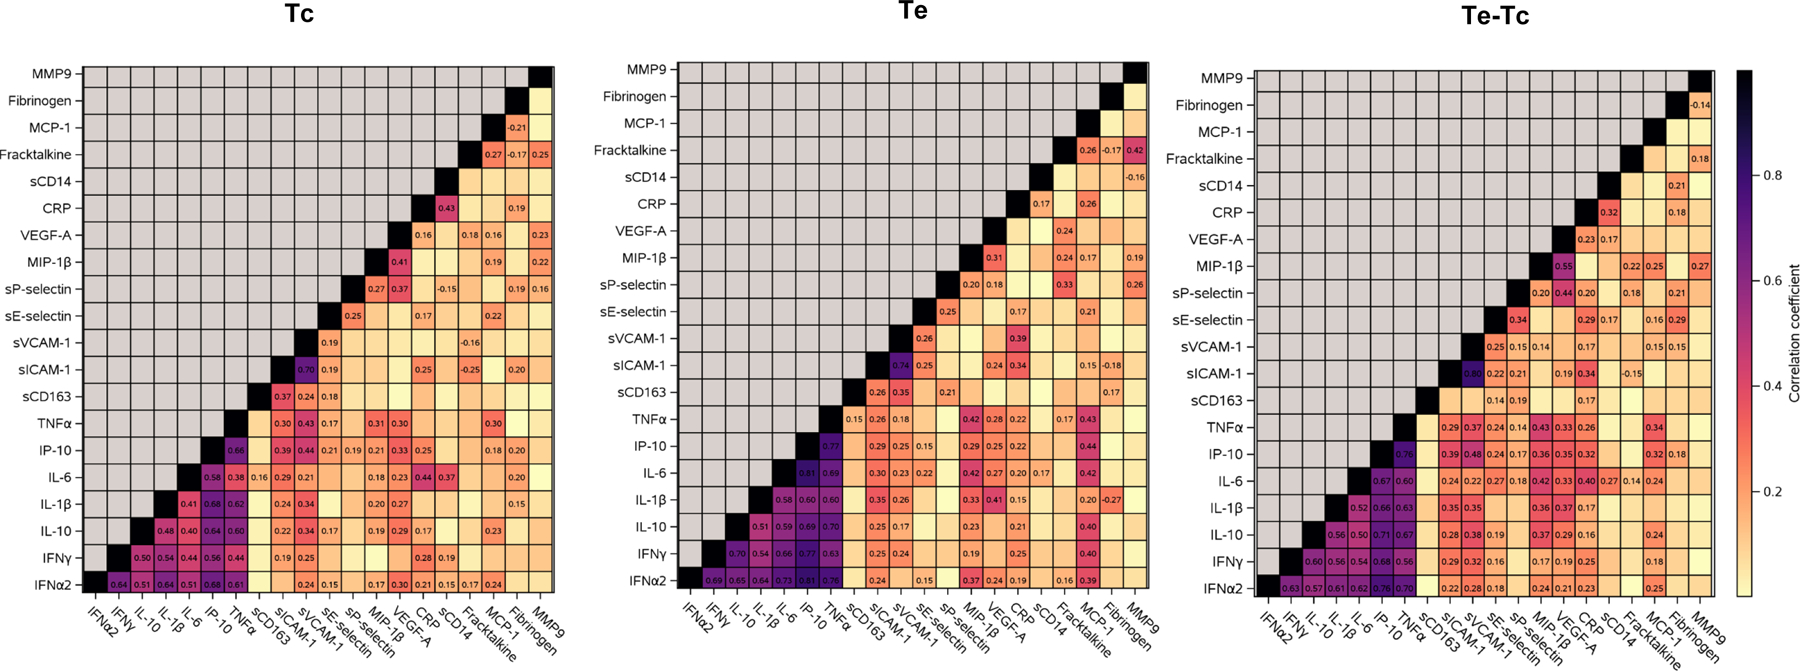
Figure 2. Plasma biomarker correlations in children with PHIV on effective ART.

Data were derived from 213 children. Graphs represent heatmaps of pairwise Spearman correlations between the markers indicated on the abscissa and ordinate at the timepoints indicated on the graphs. Coefficients of correlation are displayed on the graphs for correlations with p<0.05. Tc indicates beginning of sustained controlled viremia; Te indicates entry in P1104s when the follow up plasma sample was analyzed.
