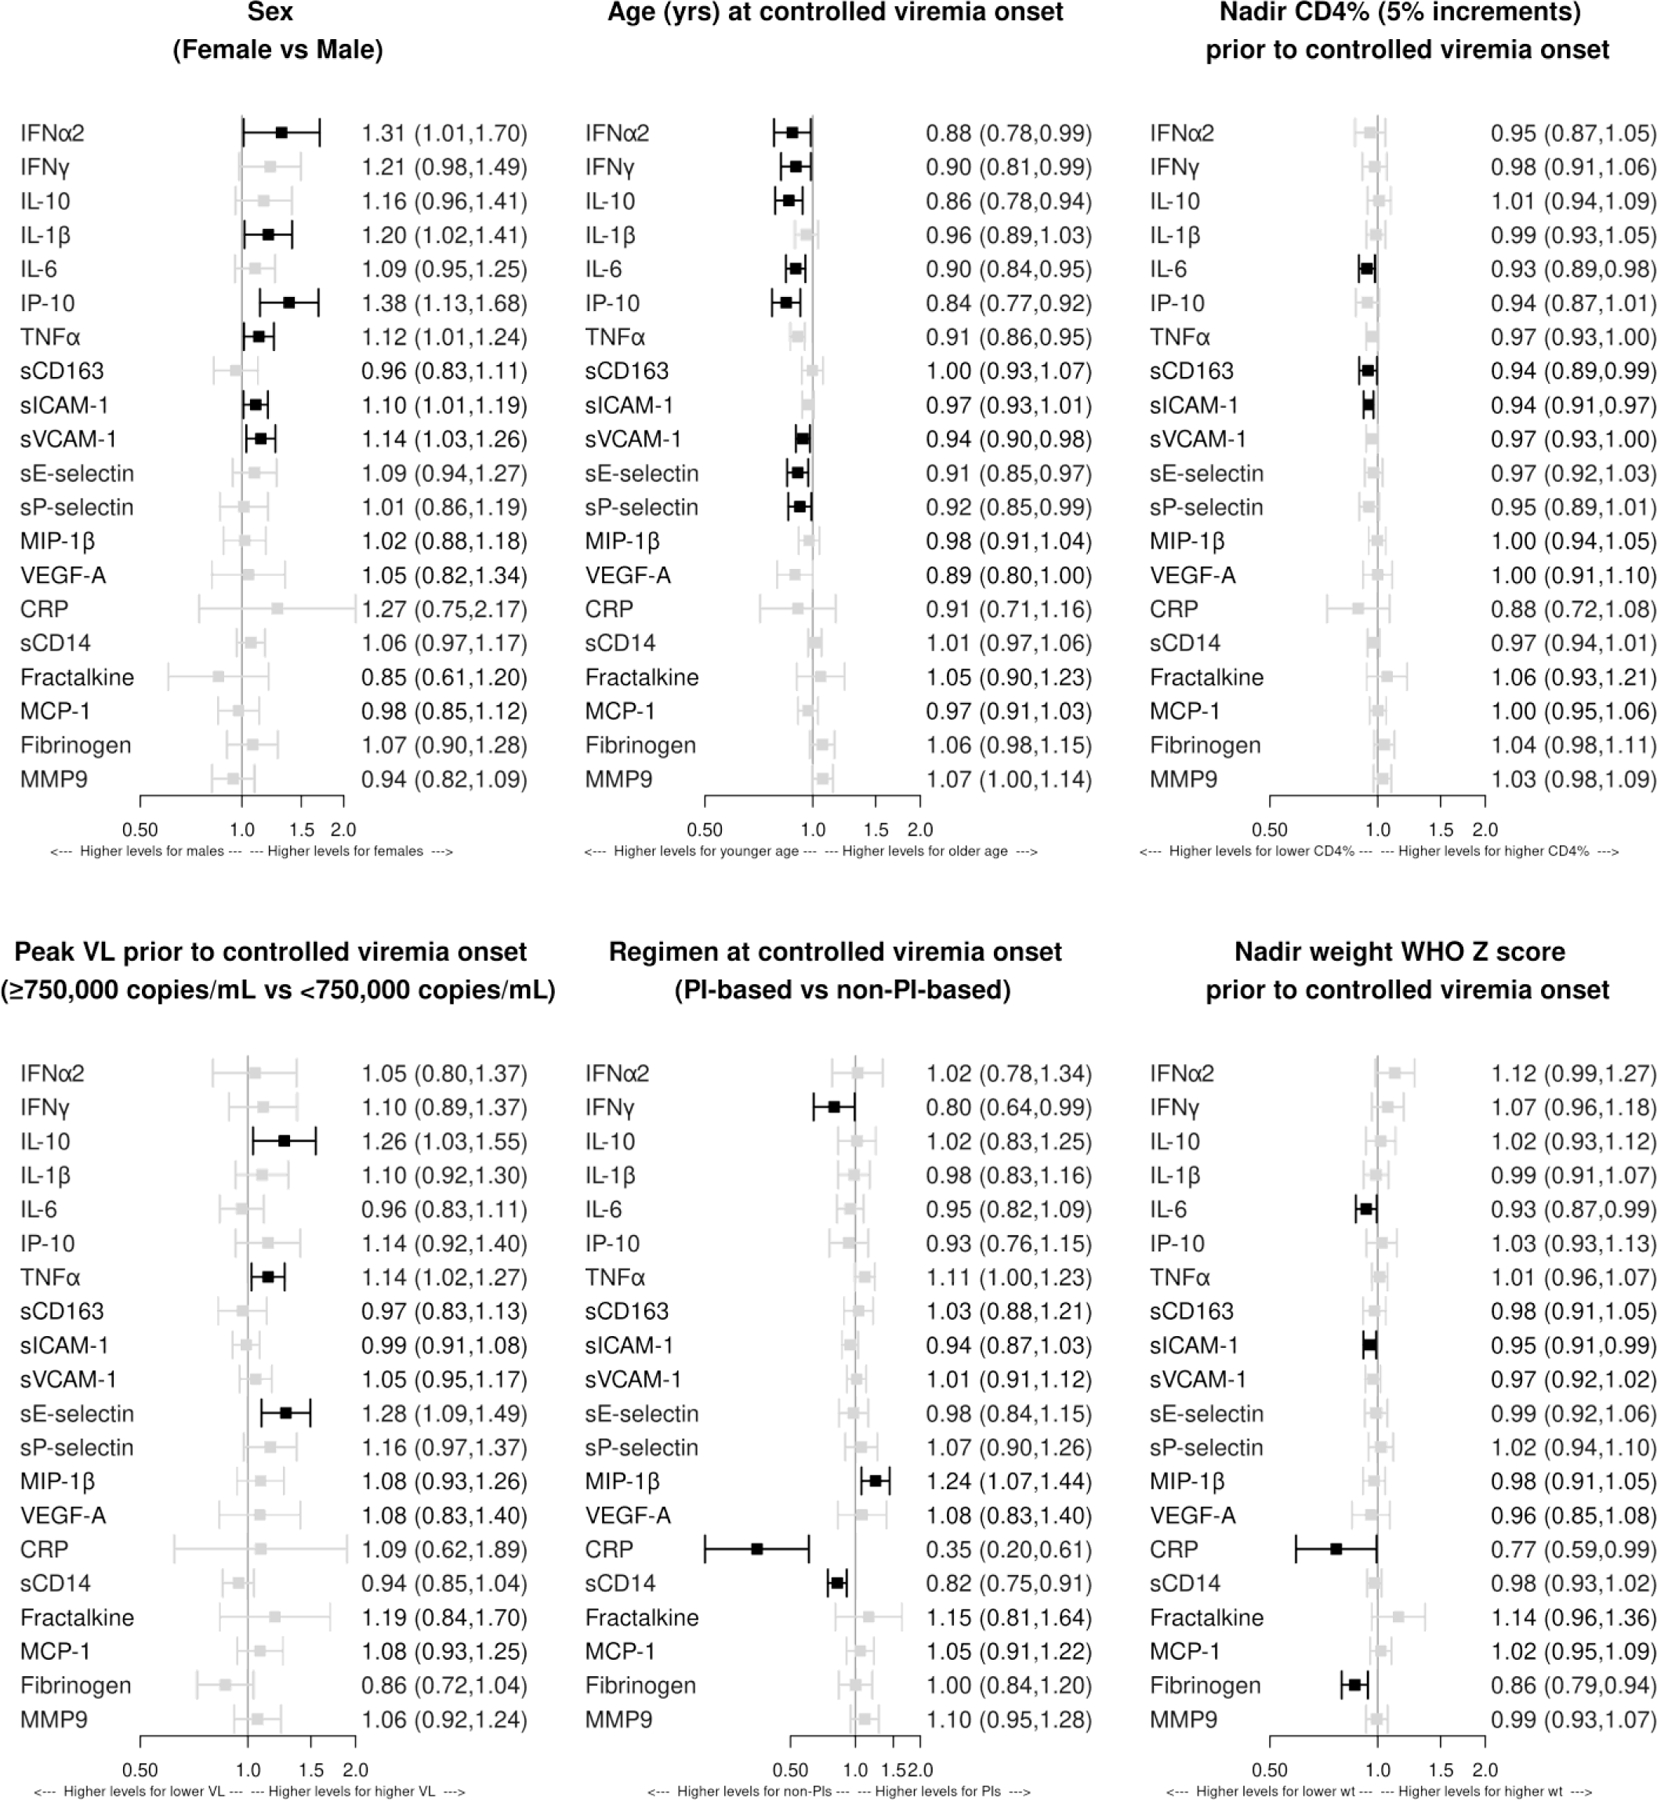
Figure 3. Association of demographic and HIV disease characteristics with biomarker levels at Tc.

Effect sizes greater than 1.0 indicate higher biomarker concentrations at Tc (initiation of controlled viremia), on average, in the comparison group relative to the referent group. Separate multivariable models were fit for each biomarker. The following covariates were included in each model: sex, age at Tc, nadir CD4%, peak plasma HIV RNA copies/ml, antiretroviral regimen at Tc, and nadir height and weight WHO Z score. There were no associations with p<0.05 of biomarker levels at Tc with nadir WHO Z scores for height and, therefore, the panel was omitted. Dark boxes indicate associations with p<0.05.
