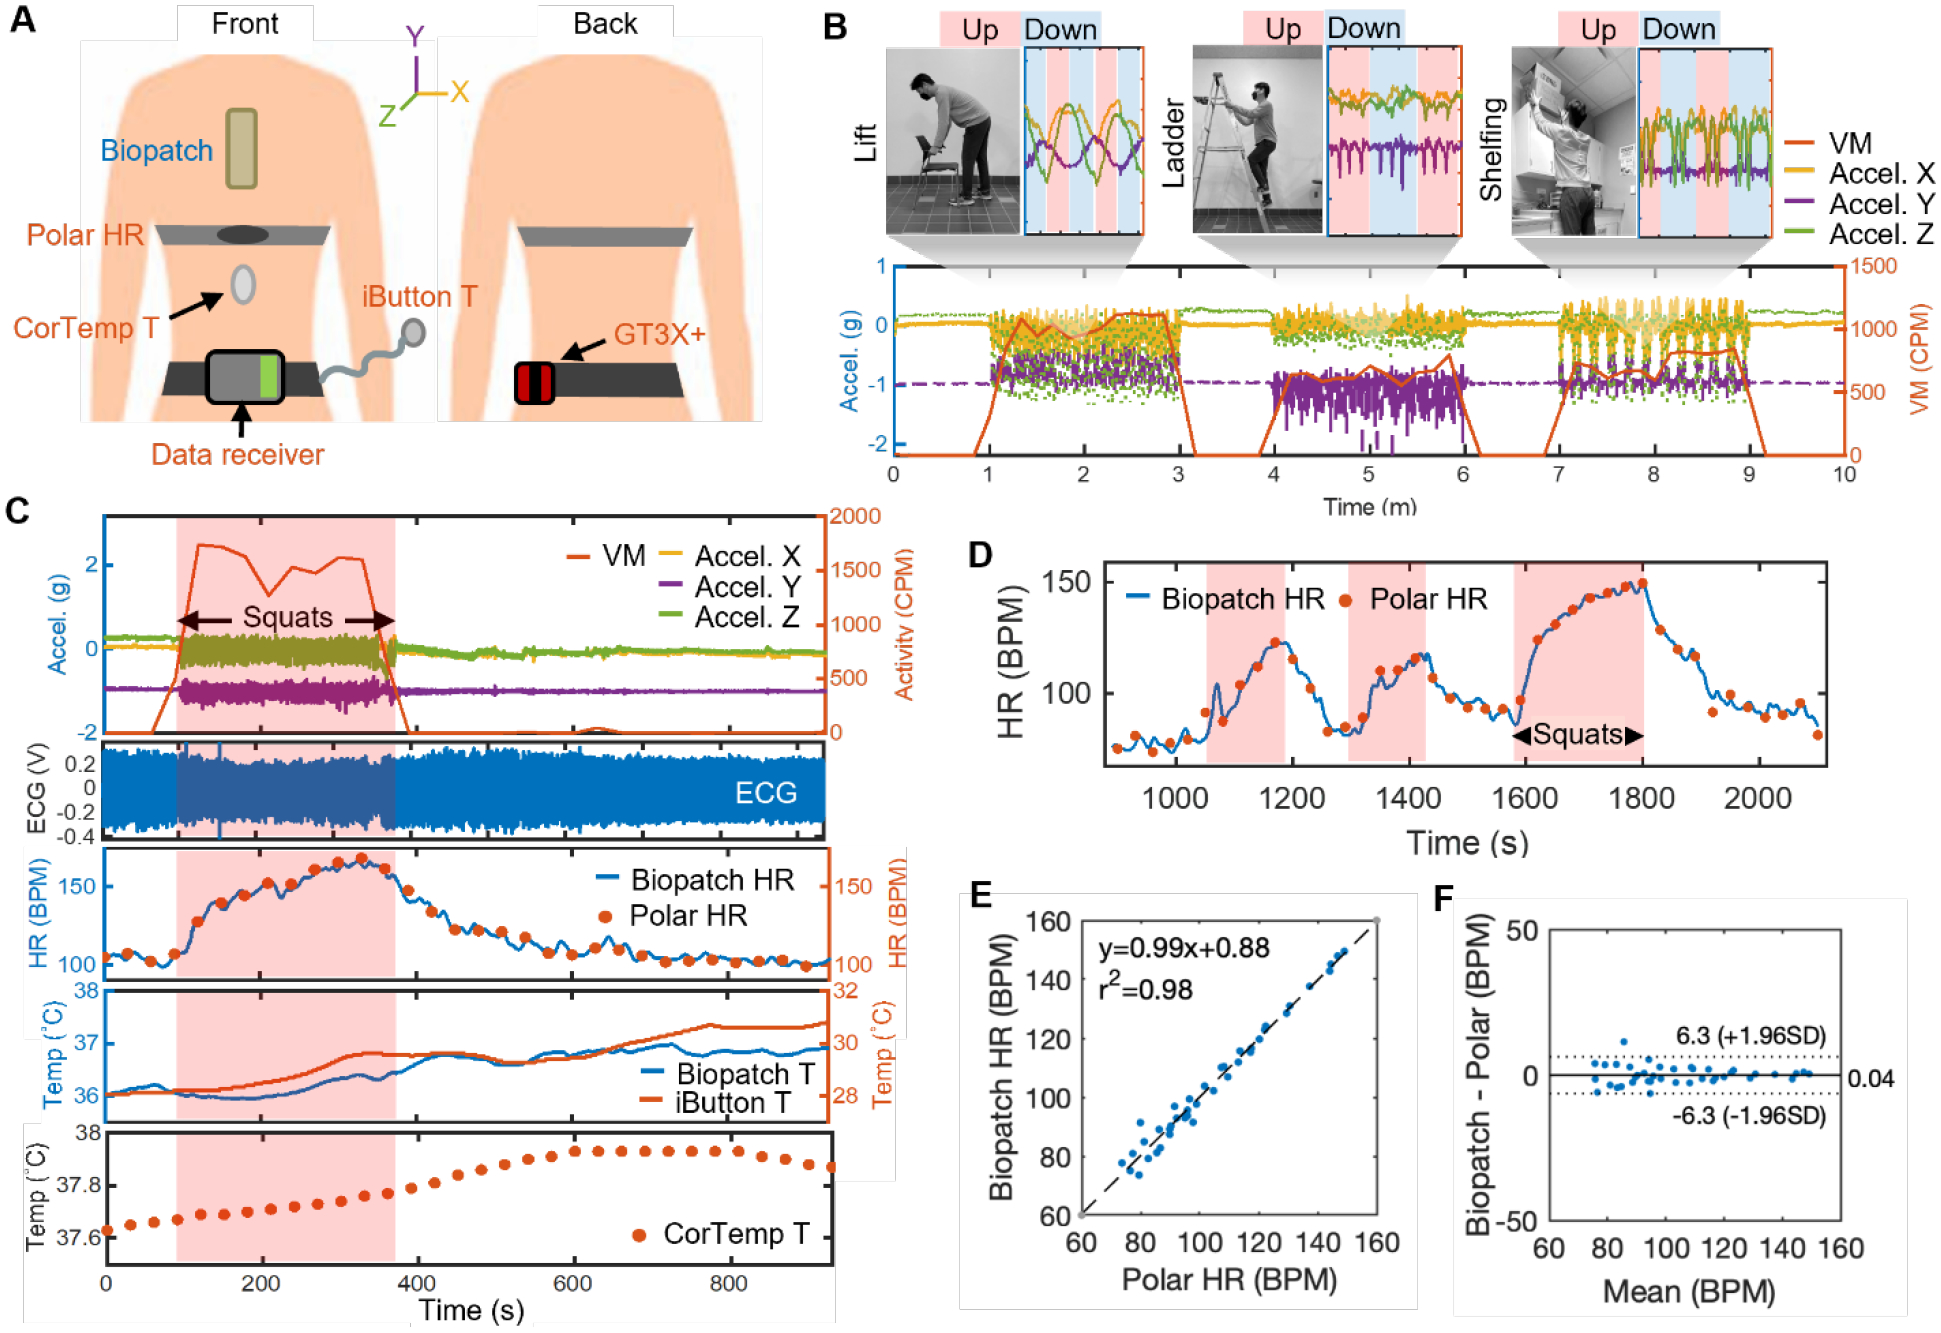
Figure 4. Evaluation of biopatch’s sensing performance.

(A) Illustration of devices used in the comparison study and attachment locations for a biopatch and multiple commercial devices. (B) Motion data captured by the biopatch and GT3X+ during simulated tasks, including lifting, ladder climbing, and shelfing. (C) Full data captured by the biopatch and commercial devices during an outdoor exercise protocol. (D) Two HR data from the biopatch’s ECG and Polar HR chest strap, overlaid to visualize the level of agreement during an outdoor exercise protocol. (E) Correlation analysis showing a highly linear relationship with the correlation coefficient of two devices. (F) Comparison of mean bias data between the two sets of HR data. Dashed lines indicate ± 1.96 SD while the center solid line represents the mean bias of +0.04 BPM.
