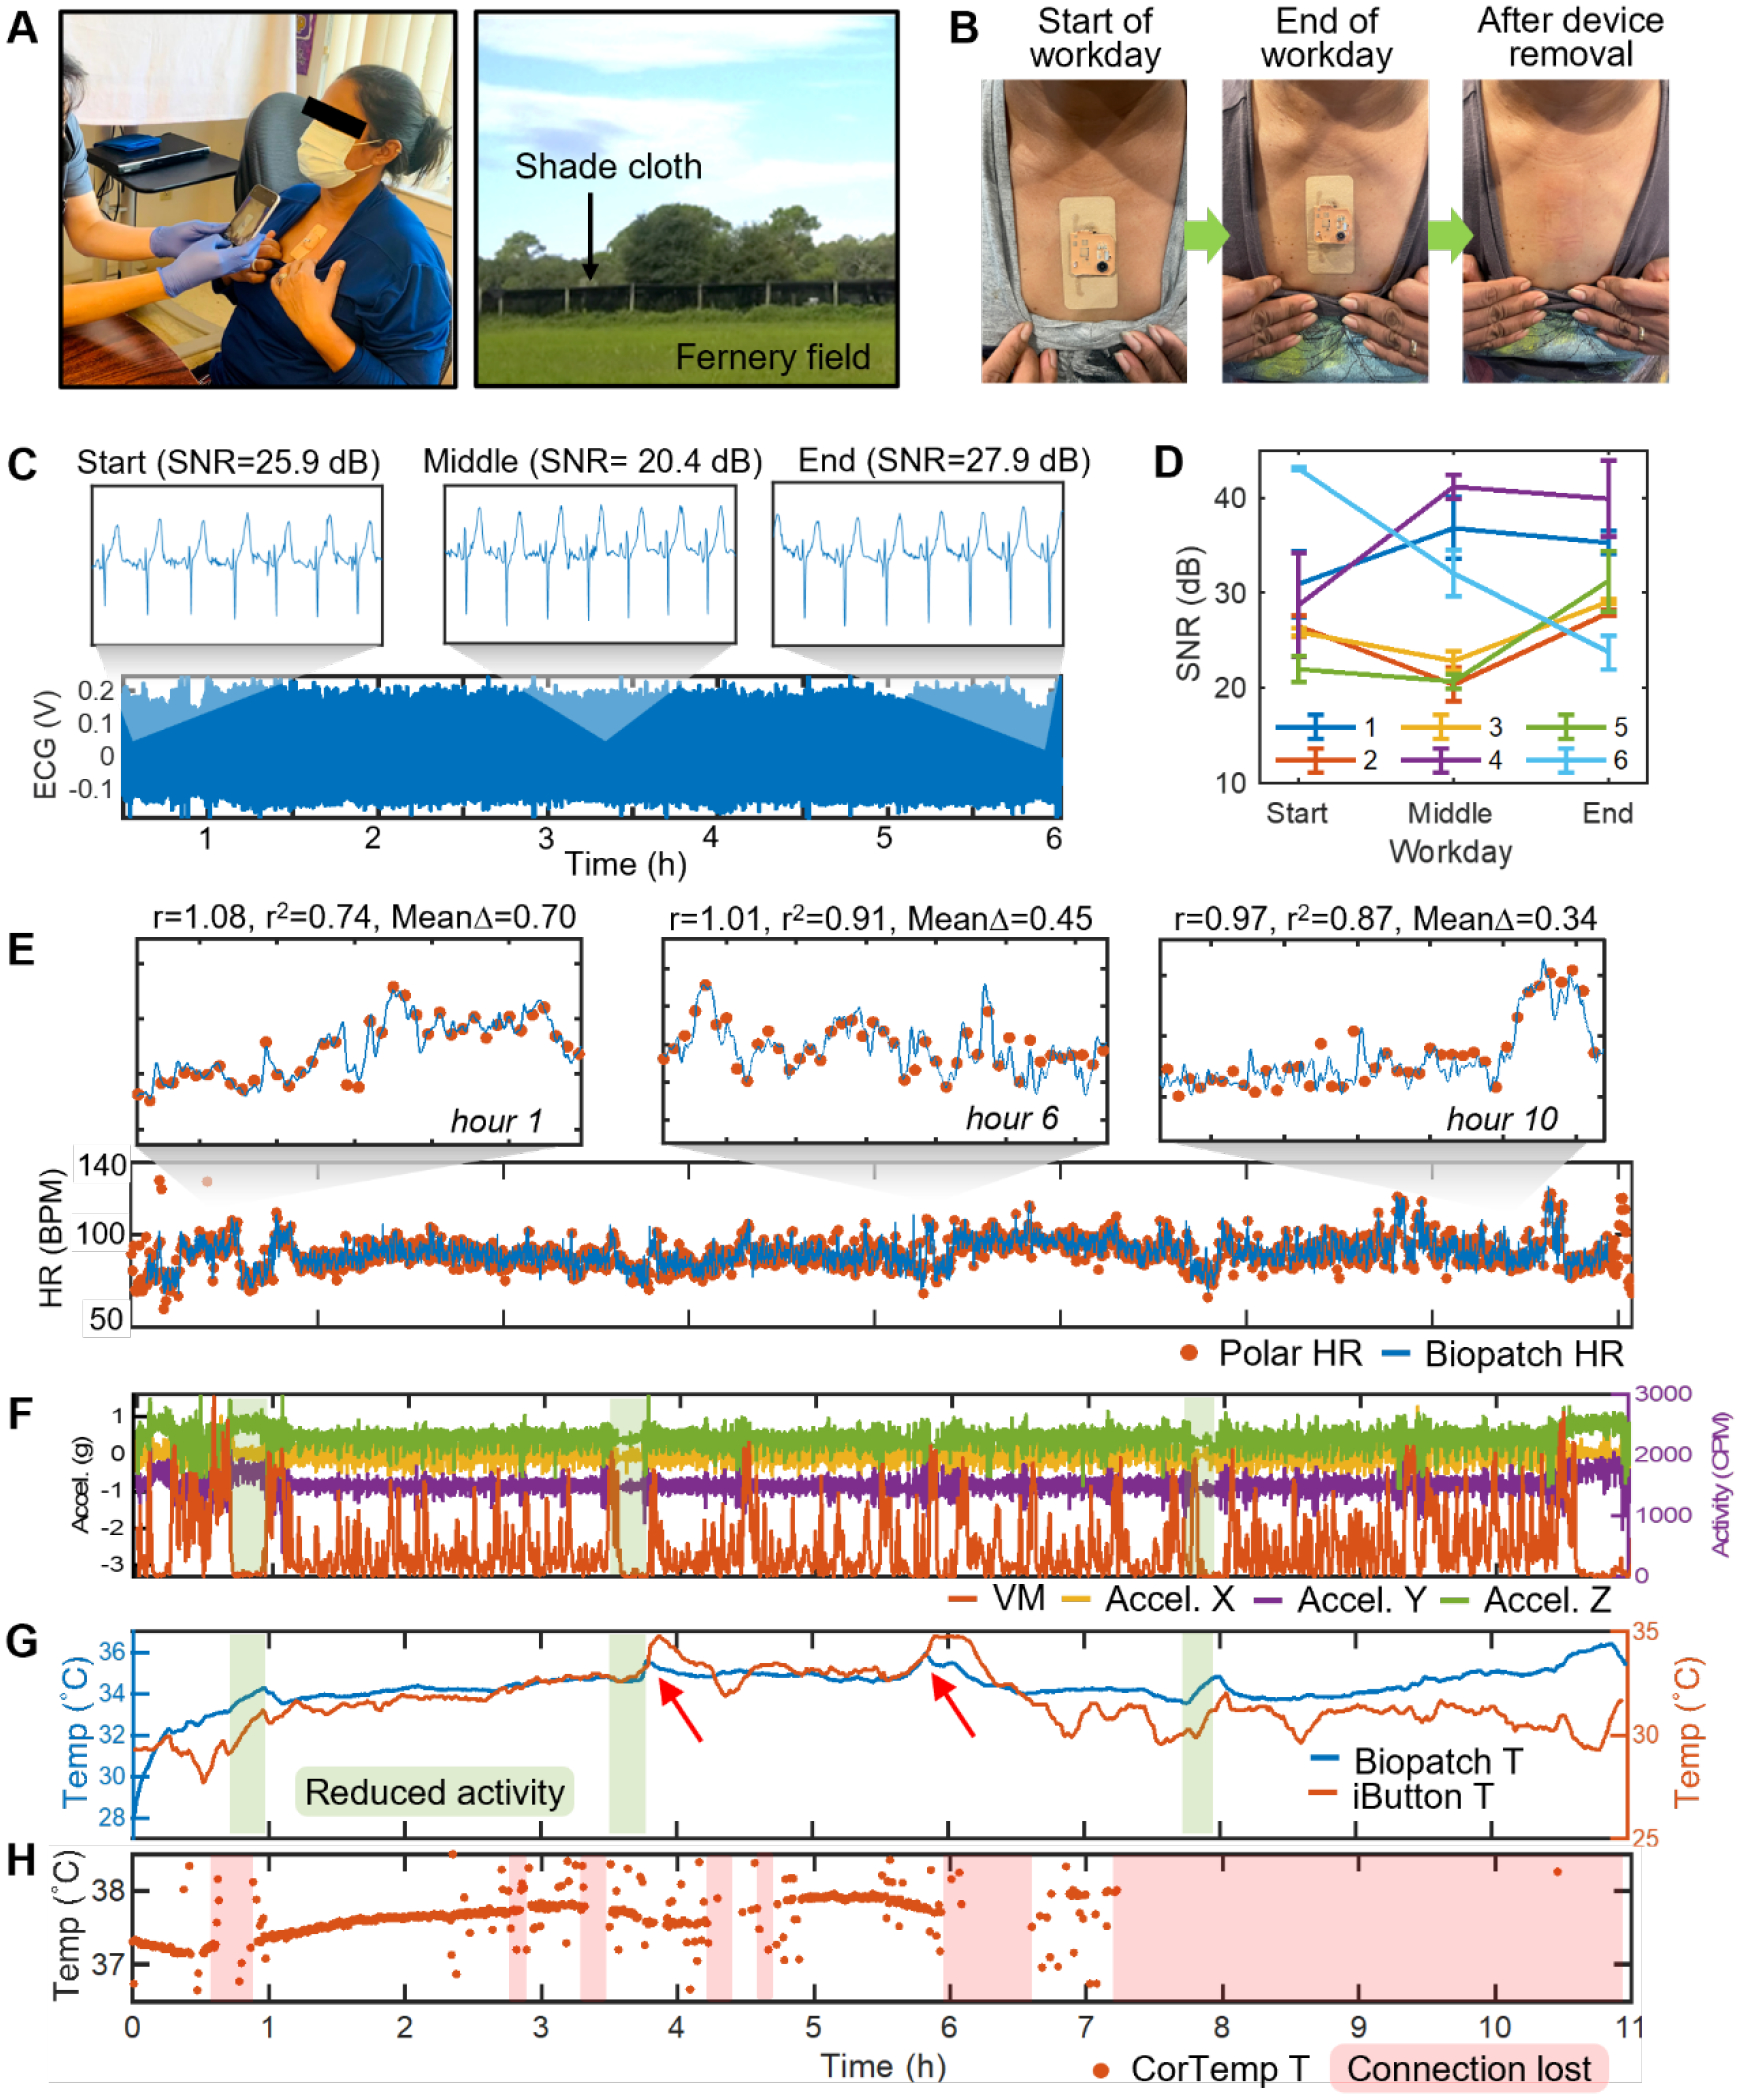
Figure 5. Deploying biopatch for health monitoring of agricultural workers.

(A) Application of the biopatch to a farmworker at the beginning of a workday (left). Photograph of a typical fernery field at the study site (right). (B) Photographs showing the device conditions at the beginning and end of a workday as well as the skin conditions immediately after the biopatch removal. (C) 6 hour-long ECG data from Participant #2 with zoomed sections showing the details of the waveform and respective SNR values at the start, middle, and end of the workday. (D) SNR of ECG at the start, middle, and end of all workdays for the six participants. Data are mean ± SD (n = 5). (E) Comparison of HR data measured from Participant #1 over the eleven hour-long workdays. 20 min-wide zoomed sections in hours 1, 6, and 10 show consistently high linear correlation and agreement between the two data. (F) Activity data recorded by GT3X+ and the biopatch. Sections colored in green represent time windows of reduced activity. (G) Skin and ambient temperature recorded by the biopatch and iButton, respectively. Red arrows point to the biopatch’s temperature sensor responding to large increases in the ambient temperature. (H) Tc recorded by CorTemp’s ingestible pill sensor. Sections colored in red indicate lost wireless connectivity between the pill sensor and the waist-worn receiver unit.
