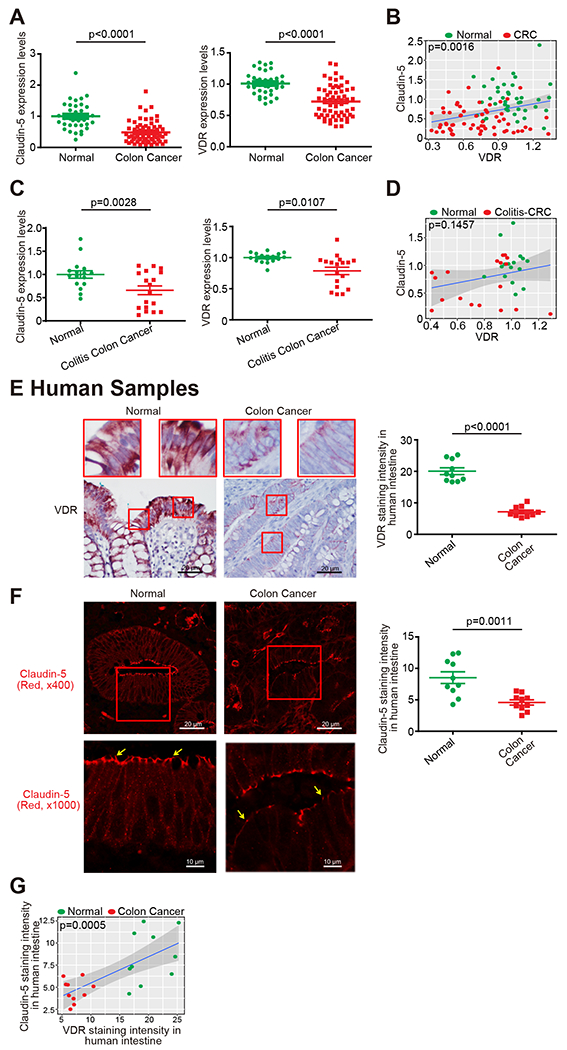
Fig. 1. Reduced VDR was correlated with low Claudin-5 expression in human colorectal cancer (CRC) patients.

(A) Reduced VDR and Claudin-5 expression in patients with CRC (GEO database GSE4183 and GSE8671, (data were expressed as mean ± SD; Normal, n=40; CRC, n=62; Student’s t-test). All p values are shown in the figure. (B) Significantly coordinated (the Pearson correlation coefficient is 0.3083 with p-value = 0.001621) expression of VDR and Claudin-5 in biopsy samples collected from CRC patients. We performed a regression of VDR against Claudin-5 and conducted a scatter plot analysis with a regression line (GEO database GSE4183 and GSE8671, Normal, n=40; CRC, n=62; Intercept = 0.244; Slope = 0.5297). Values for healthy controls are presented in blue, and values for CRC patients are presented in red. (C) Reduced VDR and Claudin-5 expression in patients with Colitis-associated CRC (GEO database GSE8671, GSE10714 and GSE37283, data were expressed as mean ± SD; Normal, n=16; Colitis-associated CRC, n=18; Student’s t-test). (D) Coordinated expression of VDR and Claudin-5 in biopsy samples collected from Colitis-associated CRC patients. We performed a regression of VDR against Claudin-5 and conducted a scatter plot analysis with a regression line (GEO database GSE8671, GSE10714, and GSE37283 Normal, n=16; Colitis-associated CRC, n=18; the Pearson correlation coefficient is 0.2549 with p-value = 0.1457). (E) Intestinal VDR staining in normal and CRC human colon samples. Compared with normal intestines, the intestine from CRC patients possessed significantly lower VDR expression. (Images are representative of experiments performed in triplicate; Normal, n=10; Colorectal cancer, n=10; Student’s t-test). (F) IF staining of Claudin-5 in normal and CRC human colon samples. Compared to normal intestines, the intestines of CRC patients exhibited significantly lower Claudin-5 expression. (Images are representative of experiments in triplicate; Normal, n=10; Colon cancer, n=10; Student’s t-test). (G) The Pearson correlation analysis of staining intensity between intestinal Claudin-5 and VDR in human colon samples (the Pearson correlation coefficient is 0.7033 with p-value = 0.0005417. n = 10 for Normal and Colon cancer, respectively). All p values are shown in this figure.
