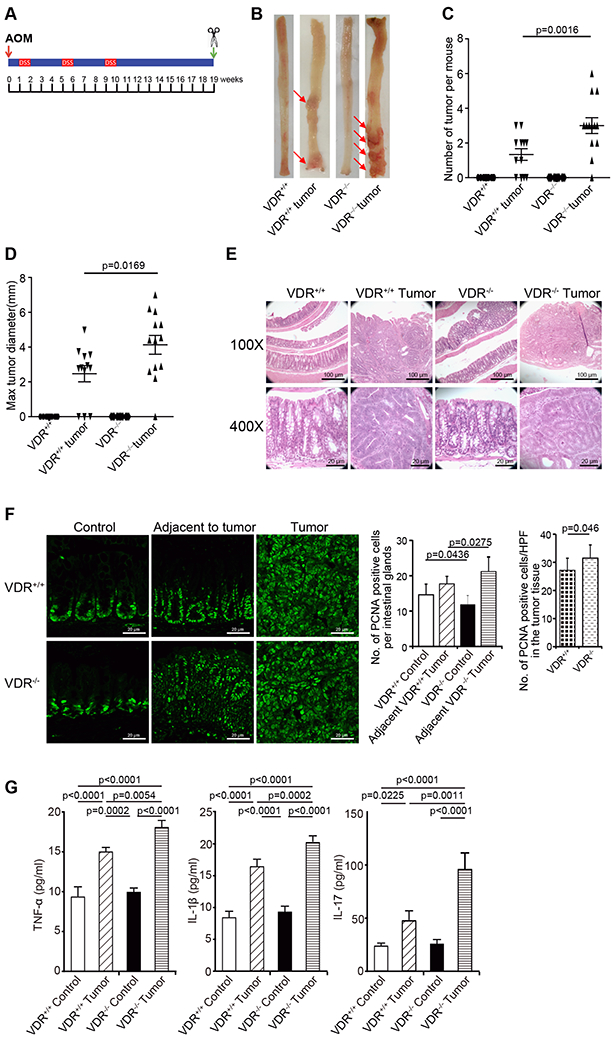
Fig. 2. VDR−/− mice developed a greater number of tumors compared to tumors in VDR+/+ mice.

(A) Schematic overview of the AOM/DSS-induced colon cancer model. AOM (10 mg/kg) was injected on day 0. On Day 7, 2% DSS solution was administered to mice in drinking water. Seven days of DSS was followed by three weeks of drinking water free of DSS. An additional two cycles of DSS were administered prior to sacrifice at Week 19. (B) Colonic tumors in situ. Representative colons from different groups. Tumors were indicated by red arrows. (C) Tumor numbers in AOM-DSS induced colon cancer model: VDR+/+ and VDR−/− mice (data are expressed as mean ± SD. n = 10-13, one-way ANOVA test). (D) Max tumor size in AOM-DSS induced colon cancer model: VDR+/+ and VDR−/− mice (data are expressed as mean ± SD. n = 10-13, one-way ANOVA test). (E) Representative H&E staining of “Swiss rolls” of representative colons from the indicated groups. Images are from a single experiment and represent 10 mice per group. (F) Quantitation of PCNA-positive cells in control mucosa per intestinal glands or in the tumors tissue per high-power field. PCNA expression in the tumor tissue of VDR−/− mice was significantly higher than that in the VDR+/+ mice (data are expressed as mean ± SD. n = 5, Student’s t-test). (G) Serum cytokines such as TNF-α, IL-1β, and IL-17 were significantly increased, particularly in the AOM-DSS-induced VDR−/− mice colon cancer model. Each single experiment was assayed in triplicate. Data are expressed as mean ± SD. n = 6, one-way ANOVA test. All p values are shown in the figure.
