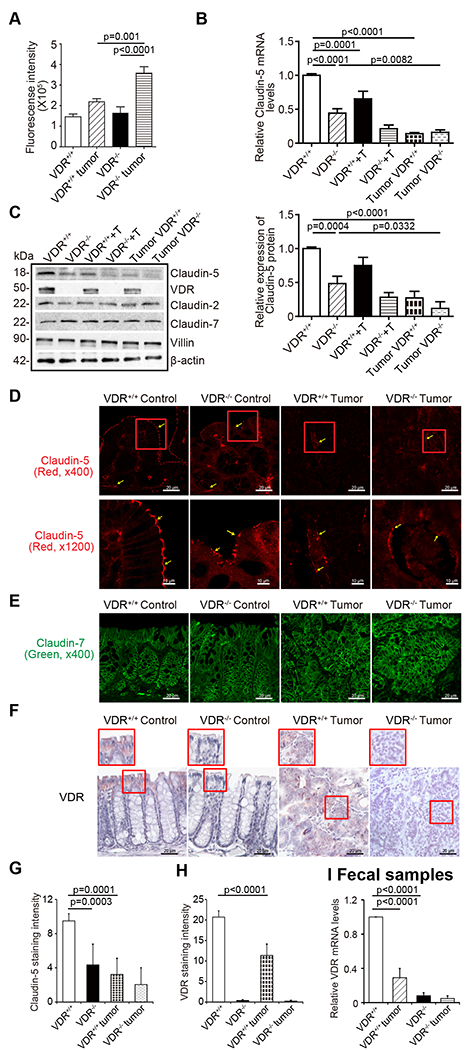
Fig. 3. VDR deletion led to decreased Claudin-5 expression in tumor tissues.

(A) Intestinal permeability increased in the AOM-DSS-induced VDR−/− mice colon cancer model. Fluorescein Dextran (Molecular weight 3 kDa, diluted in HBSS) was gavaged (50 mg/g mouse). Four hours later, mouse blood samples were collected for fluorescence intensity measurement (data are expressed as mean ± SD; n = 5 mice/group, 1-way ANOVA test). (B) VDR deletion decreased Claudin-5 at the mRNA level in the colon (data are expressed as mean ± SD. n = 5, one-way ANOVA test). (C) VDR deletion decreased Claudin-5 at the protein levels in the colon (data are expressed as mean ± SD. n = 5, one-way ANOVA test). Claudin-2 was decreased in the VDR−/− mice, compared to VDR+/+ mice in the basal condition, but there was no difference between the tumor tissue of VDR+/+ and VDR−/− mice. (D) and (G) Claudin-5 was decreased in the tumor tissue of VDR−/− mice, compared to levels in the tumor tissue of VDR+/+ mice according to immunofluorescence staining. Images are from a single experiment and represent 6 mice per group. (Data are expressed as mean ± SD. n = 6, one-way ANOVA test). (E) Claudin-7 was unchanged in the tumor tissue of VDR−/− mice, compared to levels in the tumor tissue of VDR+/+ mice according to immunofluorescence staining. Images are from a single experiment and represent 6 mice per group. (F) and (H) Intestinal VDR expression was decreased in the AOM-DSS-induced colon cancer model. Images are from a single experiment and represent 6 mice per group. (Data are expressed as mean ± SD. n = 6, one-way ANOVA test). (I) VDR levels in fecal samples were detected using RT-PCR. VDR expression was downregulated in the AOM-DSS-treated VDR+/+ mice (data are expressed as mean ± SD. n = 5, one-way ANOVA test). All p values are shown in this figure.
